 MaxedOutMama
Tuesday, June 30, 2009
Setting Aside The Insanity And Returning To The Economy
It's June. By now, I believe one thing is clear - that there is not enough global economic momentum to emerge into strong growth any time soon.
Here's why in the US, consumer confidence fell heftily in June:
Anyone who has bought gas recently probably can understand why. Current incomes are falling and prices are beginning to rise as unemployment continues to rise. The number of people who know people who are intractably unemployed must be increasing rapidly, and state and local government employees are also now feeling less secure. Thus we have a very broad-based and widely diffused set of economic difficulties. Both mean and median durations of unemployment have reached remarkable levels. Here is median:

There is really no question that demographics have a lot to do with this, but because demograpics do, don't expect to see incomes rise sharply as minor growth cycles begin to spurt off the bottom of this recession. Note that the employment/population ratio was falling before the recession started:

It's not coming back. It peaked in the 90s. It will bounce around a little bit, but employment is tight and retirements will mount. Further, a lot more people are working part time and will continue to do so. Once they can get on Medicare/Social Security, able-bodied seniors will try to work part-time to maximize their early retirement incomes. Further, a lot of government employees will retire at their first possible moment, because many of them realize that retirement benefits are going to be adjusted down, and that is least likely to happen to those who are already receiving benefits.
Chicago PMI:
This survey confirms the general manufacturing trend - a slow further decline. It is clear that we are getting to the end of the decline, but by the time we do, we will be at such a low level that it appears the economy will be tremendously weak and will have little further forward impetus. In addition, rising fuel and commodity prices are beginning to send some prices up again. A manufacturing rebound is not going to lead the US out of this recession this year.
So, is there any other constituency of the economy that could lead us out? Small businesses. There it is hard to get a feel for things. Some small businesses were staggering along, and have now given up. Some are clearly doing better as competition decreases. But when I look at the details of small business survey's such as Tatum's, I see that the underlying trend in May was still declining expenditures and contracting order backlogs, and most of the improvement in these indexes was due to future expectations. I expect some of these to take another step down in the next two months.
Go to page four of the full Tatum survey, and look at the progression there. The June index was so close to that of last year's that it doesn't offer much hope unless consumers start to spend heavily again. Note also when the collapse in the small business index began - way before the financial crisis of last fall. This recession wasn't spawned by Lehman's demise, and it wasn't spawned by credit difficulties. Both of those factors have deepened the impact considerably, but the real cause of this thing was structural, and unfortunately the structural factors have not yet been worked off.
You might also find this discussion of the NFIB small business survey interesting. Until small business profits improve, we are not going to see the hiring and spending. Note that tighter credit is becoming more of a problem for small businesses now. Again, the steep fall in this index began at the end of 2007. Go to page 8 and notice that profits seem to have stabilized at a very low level. Then go to page 9 and look at the graph for profit expectations/versus current profits. Note that small business profit expectations usually rise well ahead of actual improvement. In small banking, this is a well-known factor! In 92, for example, profit expectations shot way up but actual profits really didn't improve for 9 months more.
One of the reason for the profit expectations report lag is that small businesses often respond to an increase in sales and revenue by buying stuff, which reduces profits. The alternative is to pay more taxes to larcenous federal and state entities, which makes them feel sick. There is no one who is an easier sale than a small business proprietor or principal who's just gotten the bad news from his accountant. Because many small business owners are on the calendar tax year, one might expect that we would see a big uptick in sales to such persons at the end of the year - anything and everything that they could take off their business taxes.
However in this recession I don't expect that to happen in the normal way. There are two reasons. The first is that a number of small business owners are older, and are worried about staggering through to their retirement. They are conserving cash. The second is that I believe that commercial credit conditions are getting significantly worse and that small business owners will have trouble borrowing to buy. Whatever money they can get will be put into inventory rather than capital goods. This will suppress general economic conditions for the rest of this year. Moreover, small businesses will not improve inventory until sales move up significantly, and sales were still at their recession low in May.
Consumer-oriented small businesses seem to be folding up shop at a high rate, or staggering along waiting for the rains to come and water the fields of consumer commerce. I suspect they will not see another really good crop out of those fields for some years to come.
Consumer incomes are falling which leads to this problem:

If interest rates increase, as they should in a recovery, there is the problem that the DSR ratio may grow worse instead of better, because household credit market debt is at remarkably high levels:

In a few years, refinancing your home to cover auto or CC debt is going to be a losing proposition, and those
HELOC lines are going to turn into a big, big ouchie. What's so remarkable about this is the age of the US population. See 2008 ACS data on US population age.
About 82 million are 19 and under, and should not have much in the way of debt. Approximately 70 million are 55 and older. That, in total, is half the US population. Traditionally, the 55 and older group would be expected to have very little consumer debt and to be in the last stages of paying down their mortgages. The goal for the prior group of retirees was to clear their mortgages before 60 and to build up their nest eggs. At this point, they expected to pay for new cars with cash plus trade-in value, etc.
Obviously, the traditional metrics don't hold. The remarkable rise in household debt also occurred among a group of people who are now poorly prepared for retirement. To get further insight into the matter, we turn to the 2007 Federal Survey of Consumer Finances. I will go further into that in the next post.
It's worth noting that our demographics have a lot to do with expected future consumer spending and also with expected medical spending. An aging population is going to spend more on medical care regardless of any other trends, and pretending that it won't is stupid.
2008 Age Brackets:
Update: See Rebecca's post on world demographics. I'm not going to get to ROW for a bit yet with this series, but yes, there is a global problem.
Here's why in the US, consumer confidence fell heftily in June:
The Index now stands at 49.3 (1985=100), down from 54.8 in May. The Present Situation Index decreased to 24.8 from 29.7. The Expectations Index declined to 65.5 from 71.5 in May.This really should not be that much of a surprise, because what confidence there was among consumers in these surveys was concentrated on the future. As talk of green shoots fizzles, that fades out, and actual conditions begin to weigh on people's minds.
Anyone who has bought gas recently probably can understand why. Current incomes are falling and prices are beginning to rise as unemployment continues to rise. The number of people who know people who are intractably unemployed must be increasing rapidly, and state and local government employees are also now feeling less secure. Thus we have a very broad-based and widely diffused set of economic difficulties. Both mean and median durations of unemployment have reached remarkable levels. Here is median:
There is really no question that demographics have a lot to do with this, but because demograpics do, don't expect to see incomes rise sharply as minor growth cycles begin to spurt off the bottom of this recession. Note that the employment/population ratio was falling before the recession started:
It's not coming back. It peaked in the 90s. It will bounce around a little bit, but employment is tight and retirements will mount. Further, a lot more people are working part time and will continue to do so. Once they can get on Medicare/Social Security, able-bodied seniors will try to work part-time to maximize their early retirement incomes. Further, a lot of government employees will retire at their first possible moment, because many of them realize that retirement benefits are going to be adjusted down, and that is least likely to happen to those who are already receiving benefits.
Chicago PMI:
This survey confirms the general manufacturing trend - a slow further decline. It is clear that we are getting to the end of the decline, but by the time we do, we will be at such a low level that it appears the economy will be tremendously weak and will have little further forward impetus. In addition, rising fuel and commodity prices are beginning to send some prices up again. A manufacturing rebound is not going to lead the US out of this recession this year.
So, is there any other constituency of the economy that could lead us out? Small businesses. There it is hard to get a feel for things. Some small businesses were staggering along, and have now given up. Some are clearly doing better as competition decreases. But when I look at the details of small business survey's such as Tatum's, I see that the underlying trend in May was still declining expenditures and contracting order backlogs, and most of the improvement in these indexes was due to future expectations. I expect some of these to take another step down in the next two months.
Go to page four of the full Tatum survey, and look at the progression there. The June index was so close to that of last year's that it doesn't offer much hope unless consumers start to spend heavily again. Note also when the collapse in the small business index began - way before the financial crisis of last fall. This recession wasn't spawned by Lehman's demise, and it wasn't spawned by credit difficulties. Both of those factors have deepened the impact considerably, but the real cause of this thing was structural, and unfortunately the structural factors have not yet been worked off.
You might also find this discussion of the NFIB small business survey interesting. Until small business profits improve, we are not going to see the hiring and spending. Note that tighter credit is becoming more of a problem for small businesses now. Again, the steep fall in this index began at the end of 2007. Go to page 8 and notice that profits seem to have stabilized at a very low level. Then go to page 9 and look at the graph for profit expectations/versus current profits. Note that small business profit expectations usually rise well ahead of actual improvement. In small banking, this is a well-known factor! In 92, for example, profit expectations shot way up but actual profits really didn't improve for 9 months more.
One of the reason for the profit expectations report lag is that small businesses often respond to an increase in sales and revenue by buying stuff, which reduces profits. The alternative is to pay more taxes to larcenous federal and state entities, which makes them feel sick. There is no one who is an easier sale than a small business proprietor or principal who's just gotten the bad news from his accountant. Because many small business owners are on the calendar tax year, one might expect that we would see a big uptick in sales to such persons at the end of the year - anything and everything that they could take off their business taxes.
However in this recession I don't expect that to happen in the normal way. There are two reasons. The first is that a number of small business owners are older, and are worried about staggering through to their retirement. They are conserving cash. The second is that I believe that commercial credit conditions are getting significantly worse and that small business owners will have trouble borrowing to buy. Whatever money they can get will be put into inventory rather than capital goods. This will suppress general economic conditions for the rest of this year. Moreover, small businesses will not improve inventory until sales move up significantly, and sales were still at their recession low in May.
Consumer-oriented small businesses seem to be folding up shop at a high rate, or staggering along waiting for the rains to come and water the fields of consumer commerce. I suspect they will not see another really good crop out of those fields for some years to come.
Consumer incomes are falling which leads to this problem:
If interest rates increase, as they should in a recovery, there is the problem that the DSR ratio may grow worse instead of better, because household credit market debt is at remarkably high levels:
In a few years, refinancing your home to cover auto or CC debt is going to be a losing proposition, and those
HELOC lines are going to turn into a big, big ouchie. What's so remarkable about this is the age of the US population. See 2008 ACS data on US population age.
About 82 million are 19 and under, and should not have much in the way of debt. Approximately 70 million are 55 and older. That, in total, is half the US population. Traditionally, the 55 and older group would be expected to have very little consumer debt and to be in the last stages of paying down their mortgages. The goal for the prior group of retirees was to clear their mortgages before 60 and to build up their nest eggs. At this point, they expected to pay for new cars with cash plus trade-in value, etc.
Obviously, the traditional metrics don't hold. The remarkable rise in household debt also occurred among a group of people who are now poorly prepared for retirement. To get further insight into the matter, we turn to the 2007 Federal Survey of Consumer Finances. I will go further into that in the next post.
It's worth noting that our demographics have a lot to do with expected future consumer spending and also with expected medical spending. An aging population is going to spend more on medical care regardless of any other trends, and pretending that it won't is stupid.
2008 Age Brackets:
Under 5 years | 21,005,852 |
5 to 9 years | 20,065,249 |
10 to 14 years | 20,054,627 |
15 to 19 years | 21,514,358 |
20 to 24 years | 21,058,981 |
25 to 34 years | 40,931,565 |
35 to 44 years | 42,501,130 |
45 to 54 years | 44,372,065 |
55 to 59 years | 18,583,445 |
60 to 64 years | 15,102,736 |
65 to 74 years | 20,122,941 |
75 to 84 years | 13,025,007 |
85 years and over | 5,721,768 |
Update: See Rebecca's post on world demographics. I'm not going to get to ROW for a bit yet with this series, but yes, there is a global problem.
Friday, June 26, 2009
So, What's Going To Replace The Democratic Party?
I watched some of the debate on the Waxman-Malarkey bill today before Gaia got mad and started throwing huge thunderbolts, causing me to unplug everything and seek cover.
While I was un-carbon-producing (except for my breathing), it was passed. See David's Chicago-Boyz post.
I don't think the average person realizes that much of our current power plant dates from decades ago, that nuclear plants are going to going off line in about a decade due to age, and that we are apparently signing on to something that will raise the basic cost of living in a very substantial way, without actually having any alternatives.
We are at the point when this will come home quite quickly. The current bill has a ridiculous goal of cutting US per capita carbon dioxide emissions back to the 1700s. Needless to say, that will never come to pass. And most of the current bill's provisions are backloaded to later dates, but even the renewable energy mandates will raise fuel costs significantly within 5-6 years.
At some point, the peasants will revolt. It is almost as if this bill was a conspiracy of California Democrats who feel the need to bankrupt the rest of this country so that California will have an equal chance at funding, or something like that.
Volokh's Jim Lindgren has written several very good posts on this bill - this one, from months ago, reviews the ridiculous goal of the bill. This post from today reviews the central problem related to trade.
It's the inane nature of this bill that astounds me. We just cannot do it. Growing the food necessary to feed even our own population would emit more carbon than the final goals in the bill, even if every household in the USA was burning candles for light and had returned to the lifestyle that Paul Ehrlich used to recommend.
Okay, so in pursuit of a goal that's nonsensical, for a problem that is international and that will not be addressed internationally (India and China, for example, are refusing to starve their people to death), we adopt legislation that either sets up an iron wall of tariffs or drives half the nation into poverty in about 15 years. This is the most bizarre thing I have ever seen in my lifetime.
Let's hope it can be stopped in the Senate. Even if it is, our nation has lost something here, and that something is the principal legislative body's grasp on reality. It is as if the House of Representatives suddenly passed a vote to reduce gravity by 10 percent in order to lessen the costs of obesity to putatively cut Medicare costs in the future. Truly amazing.
I strongly recommend reviewing the figures in this old WSJ piece on the goal and then at least look at the abstract on crop emissions. The full article will cost you ten bucks.
I haven't, btw, reviewed the revised version. But some earlier work I did during the election suggested that anything expensive enough to reduce US carbon emissions by 10% would also cut GDP by about 12% (rolling time frame 3 years after initiative introduction).
I'm completely stunned.
Thursday, June 25, 2009
The Titanic Sails
Weekly claims came out higher - 627,000 SA this week, and last week's was revised to 612,000. That boosted the 4 week running average.
However, this is not significant, just as the earlier drops weren't significant. One factor about the June claims reports are the seasonal adjustments, and this year the seasonal adjustments were likely to be distorted lower earlier and higher later. The reason is that there is a big pulse of claims from closing school systems, and last winter was quite a brutal one in many areas. The probability is that calendars were adjusted later to account for snow and adverse weather days. Not that claims in the 600,000 range are ever a sign of green shoots!
Q1 final GDP was released today and it came out as -5.5%. Not that this is really final - GDP gets revised for quite some time. For the US, two consecutive quarters of annualized drops in excess of 5% are really shocking. Notable factors in Q1 were the drops in real government spending (-4.5% federal and -2.2% state), drops in real gross domestic purchases (-7.5% compared to -5.9% in the fourth quarter), and real gross GNP of -5.6% in Q1 and Q4. GNP includes net receipts from outside the US, whereas GDP does not. However GNP has a lot to do with whether corporations can spend more and corporate income tax receipts. So this is not a favorable factor and it highlights concerns over the future.
I would like to call your attention to Table 8 in the link above. This shows the rolling 4 quarter percent change (change over the past year) for the various categories. The rolling four-quarter change for GDP is now -2.5%. Far more frightening is the same figure for gross private domestic investment, which in Q1 was -23.6%, and has now been falling since fourth quarter 2006! Gross private domestic investment is the fundamental driver of this economy and just about every other economy, and at no time can one ever rack up a such a string of GPDI decreases in an economy without generating a pretty intense recession.
That is the first thing on which every realistic economist must stay concentrated. Talk about a credit crisis does not address the fundamental economic operator, and dumping a lot of stimulus money into the economy will not overcome a recession produced by collapsing GPDI unless it boosts domestic investment - which our stimulus package does not.
Since we aren't bothering to boost domestic investment much, improvement will wait upon a stabilization and then increase of corporate profits. And not only that - the stabilization and increase of corporate profits must come from non-financial companies, because financial companies have a huge line of waiting losses queued for the next couple of years.
If you refer to Table 12, you'll see that domestic industries racked up a 76.2 billion dollar fall in profits in 07, and a 328.8 fall in profits in 08. However, in Q1 profits from domestic industries increased by 120.3 billion. That would bring a large smile to our faces, except that in fact 118.8 billion of that came from financials, and only 1.6 billion originated in other industries.
The problem with the financial profits is that at least half of them are fake, having been generated by highly creative accounting and overly low loss reserves, and about a quarter of the rest were generated by the very low interest rates and rolling of loans. Thus, do not expect financial profits to carry the economy forward in the coming year. The financials are still a black hole sucking up US income. In fact, this is the US money hole discussed by an eminent panel of scholars rounded up by the Onion (video).
The stabilization of non-financial profits in Q1 is favorable. Much of it was generated by the pronounced drop in producer prices. Indeed, the net of all other industries except for utilities was negative - utilities racked up a 12.7 billion increase on mostly lower input costs. Thus we have a picture of a first quarter economy which was struggling to readapt and reach a point of stability. Profit declines in wholesale trade were -44.4 billion, for example. Profit in retail increased by 13.3 billion. Manufacturing came in about at 0 for durables, but turned in non-durable declines of 16.2 billion, which were all attributable to the declines of oil and coal. ROW turned in a decline of 16.6 billion.
In 2006 the ratio of financial/non-financial profits was 49%. In 2007, it was 49%. In 2008, 38%. In Q1 09, just under 34%. Since the maximum sustainable US ratio of financial/nonfinancial profits is probably in the 25-30% range going forward, we have further to travel. If we do not plan on being very poor, obviously we need to expand non-financial profits.
And that raises a dire question about the Waxman energy plan and the Obama administration's energy policy. If we raise energy costs, we must further constrain non-financial profits in an environment in which individual incomes are dropping.
Thus, the major questions facing the US economy are based on government policy initiatives, which is rarely a positive factor in forecasting. Barring massive investment in nuclear energy and further hydropower projects (the scope for which is limited in the US), there is no way to obtain "green" energy that is not considerably more expensive than current energy sources. This will cut US disposable personal and business incomes significantly, and strike another blow at domestic manufacturing. There is no way around it. All countries which have heavily invested in "green" power have cut jobs, raised consumer energy costs, and impaired their own economies. We will not be any different.
Further, any long-term shift to electric vehicles would certainly rely on steady, reliable and cheap generation of electricity. I experienced the oddest sensation of sheer incredulity when watching the Obama press conference this week. Economically, the Obama administration's plan amounts to finding an iceberg and running the ship of state into it, apparently on the theory that we are unsinkable.
Consider this: any realistic plan to substantially expand US medical insurance coverage will involve very substantial tax hikes on US workers. Private insurance isn't even the main factor - to expand Medicare to all Americans would involve an additional wage tax of about 14.5%, and that would have to rise as the population aged.
To combine substantial tax hikes on workers with an energy policy which will substantially increase energy costs to workers, raise the price of goods, and diminish US profits is to theorize that we are going to cut real US consumer disposable incomes on the order of 20%. Needless to say, the havoc produced in retail and housing and consumer debt would be immense. US citizens may believe that things can't get worse, but things can!
One bright note: China would be even worse hit than the US. Not only would their dollar holdings devalue, but US living standards will plummet, which means that China's exports to the US would continue to plummet.
Tuesday, June 23, 2009
Just One Small Discrepancy
Earlier I expressed skepticism as to the establishment figure for May's employment report, noting that it did not match the household survey at all.
This article discussing BLS's mass layoffs report for May lends additional force to my skepticism:
When times are tight, one of the main strategies is to allow attrition to work - it is certainly cheaper. There are also a huge number of total US workers in small companies that will never show up in a mass layoff report because there are too few total workers. I strongly suspect that the Births in the Birth/Death adjustment were overcounted due to reliance on data obtained before the sharp downturn, and I think many of them will disappear in a later revision.
And, btw, continuing claims are dropping mostly because people are falling off the rolls. There are now people dropping off the extended benefit rolls.
This article discussing BLS's mass layoffs report for May lends additional force to my skepticism:
The number of mass layoffs by U.S. employers rose last month to tie a record set in March, according to government data released on Tuesday that suggested the labor market has yet to stabilize.It would be virtually impossible for mass layoffs amounting to 312,000 jobs to constitute the vast majority of the jobs lost in May, and the official results of the establishment survey were that only 345,000 non-farm jobs were lost. No other piece of data matched that one. Not ADP, not the establishment survey, not the initial and not continuing claims. The number of mass layoffs reported for May was the highest since this data has been collected.
The Labor Department said the number of mass layoff actions -- defined as job cuts involving at least 50 people from a single employer -- increased to 2,933 in May from 2,712 in April, resulting in the loss of 312,880 jobs.
When times are tight, one of the main strategies is to allow attrition to work - it is certainly cheaper. There are also a huge number of total US workers in small companies that will never show up in a mass layoff report because there are too few total workers. I strongly suspect that the Births in the Birth/Death adjustment were overcounted due to reliance on data obtained before the sharp downturn, and I think many of them will disappear in a later revision.
And, btw, continuing claims are dropping mostly because people are falling off the rolls. There are now people dropping off the extended benefit rolls.
And Optimism Wears Thinner
In the US, both Redbook and ICSC Goldman retail reports are showing very poor June figures so far this month. These reports don't include WalMart, but both are currently predicting same-store sales dropping over 4% from May. Once again they are blaming weather.
European PMI came in weaker than expected at 44.4 versus the predicted 44.9. That is solidly in the contraction zone. French consumer spending fell in May, and German PMI fell to 43.4 from May's 44.
In the meantime, rising freight rates are causing problems around the world as current fuel prices dictate higher pricing in a world trade contraction.
As many observers are beginning to comment, the current contraction in world trade is on pace with that of the Great Depression. See, for example, Mauldin's current Outside the Box newsletter entitled A Tale of Two Depressions:
My opinion (and it's just my opinion) is that Europe should cut its energy tariffs heavily and that there should be a concerted international effort to properly regulate energy exchanges such as ICE. There is not much you can do about buying and holding of energy, nor is there anything you can do about dysfunctional but energy-rich countries such as Venezuela and Iran. Venezuela is about to lose more energy money due to the ongoing seizures of assets. We can safely say that such countries are not going to be expanding energy production because they are lethal to investors.
The US should sharply shift its energy policy. We need to drill and we need to develop our own oil shale resources. Nuclear energy should be a priority but is not, and in the near term we will be forced to expand coal-produced electricity.
Still, none of this is any good unless the emerging countries stop subsidizing energy and the western world stops the stupid subsidies for renewables that can never produce energy at competitive rates. Energy production is such a baseline input to the world economy that no other government policy can compensate for a bad international energy policy.
I am strongly in favor of renewables, but the reality is that heavily subsidizing renewables is draining economic resources at an ever-increasing rate at a time when we can least afford it. Why, for example, should Italian utilities be buying electricity from consumers at more than twice the rate at which they provide it? What type of collective pyschosis causes the CA legislature of a bankrupt state government to create an energy policy that will cost the state over 100 billion dollars over a decade and raise energy prices by 28%?
Economic efficiency MATTERS. Economic downturns end when economic efficiency rebounds to the point at which more people can buy more products and a growth pattern resumes. You have to let the world adapt to growth by letting it adapt rather than by adopting ridiculous policies to push on a string.
The end game for almost all of this - including bad tax policies in some European countries, overconsumption in the US, bizarre energy policies, government overexpansion, demographic changes and world trade imbalances - is now upon us. We won't defer the time of reckoning past this year, if I am reading the freight tea leaves correctly.
European PMI came in weaker than expected at 44.4 versus the predicted 44.9. That is solidly in the contraction zone. French consumer spending fell in May, and German PMI fell to 43.4 from May's 44.
A flash manufacturing PMI index rose to 40.5 from 39.6 in May. By contrast, the flash services PMI reading fell to 44.3 from 45.2 last month.Well, not if consumer spending continues to fall. Eastern Europe is, on the whole, still weakening. If the French aren't going to buy stuff, there doesn't seem to be all that much prospects of a true rebound. Italy is in very difficult straits, Spain is an ongoing bust (-7.4% in the first quarter), most of northern Europe continues a depression-like sag, and now European services for June showed a declining trend that is quite inconsistent with hopes for a second-half rebound:
PMI data on the manufacturing sector showing the ratio of new orders to stocks of finished goods dipped to 1.12 after rising to 1.18 in May.
"That ratio remains at a level that is consistent with a further recovery of output," Williamson said.
Figures published by Markit Economics Tuesday showed the euro zone's service-sector preliminary purchasing managers index, a closely watched gauge of private-sector activity, dipped to 44.5 in June from 44.8 in May, well below the 45.8 reading expected by economists.The result of these figures will be further retraction in manufacturing. Use Swiss watches as a guide:
"The failure of the service-sector PMIs to make further gains may lie in the fact that unemployment is beginning to pick up sharply in the euro zone," Matthew Sharratt, a European economist at Bank of America Merrill Lynch, said in a note.
Watch exports tumbled 27.6 percent in May, data from the Swiss Watch Federation showed on Tuesday, bringing the drop in demand in the first five months of the year to 25 percent.There's going to be a nasty knock-on effect through the next 8 months as rising unemployment erodes the effect of the lower interest rates and consumer subsidies in the developed economies.
...
Demand from Hong Kong, the biggest market for Swiss watches, fell by 26.2 percent, while exports to the United States tumbled 42.7 percent -- largely in line with the pace of decline in the previous month, the federation said.
Exports to France and Germany slipped 13.5 percent, while demand from Italy dropped 17.8 percent.
"Now, for the first time we saw that Western European countries had a double-digit decline," Weber said.
In the meantime, rising freight rates are causing problems around the world as current fuel prices dictate higher pricing in a world trade contraction.
As many observers are beginning to comment, the current contraction in world trade is on pace with that of the Great Depression. See, for example, Mauldin's current Outside the Box newsletter entitled A Tale of Two Depressions:
This week's Outside the box looks at some very interesting research done by two economic historians, Barry Eichengreen of the University of California at Berkeley and Kevin O'Rourke of Trinity College, Dublin They give us comparisons between the Great Depression and today's downturn. They continue to update their data from time to time, the link to their work is at http://www.voxeu.org/index.php?q=node/3421. I have not previously heard of www.voxeu.org, but it is a collection of the work of well regarded international economists that seems quite interesting for those who enjoy readings in the dismal science.The charts are not very friendly. The bottom line is that only a very different response to these events will prevent a severe and extended global decline from forming. Velocity must be stimulated. One of the very big factors slowing velocity and likely to slow velocity much more in the near future are effective fuel costs.
This week's OTB will print long, but it is primarily charts.
My opinion (and it's just my opinion) is that Europe should cut its energy tariffs heavily and that there should be a concerted international effort to properly regulate energy exchanges such as ICE. There is not much you can do about buying and holding of energy, nor is there anything you can do about dysfunctional but energy-rich countries such as Venezuela and Iran. Venezuela is about to lose more energy money due to the ongoing seizures of assets. We can safely say that such countries are not going to be expanding energy production because they are lethal to investors.
The US should sharply shift its energy policy. We need to drill and we need to develop our own oil shale resources. Nuclear energy should be a priority but is not, and in the near term we will be forced to expand coal-produced electricity.
Still, none of this is any good unless the emerging countries stop subsidizing energy and the western world stops the stupid subsidies for renewables that can never produce energy at competitive rates. Energy production is such a baseline input to the world economy that no other government policy can compensate for a bad international energy policy.
I am strongly in favor of renewables, but the reality is that heavily subsidizing renewables is draining economic resources at an ever-increasing rate at a time when we can least afford it. Why, for example, should Italian utilities be buying electricity from consumers at more than twice the rate at which they provide it? What type of collective pyschosis causes the CA legislature of a bankrupt state government to create an energy policy that will cost the state over 100 billion dollars over a decade and raise energy prices by 28%?
Economic efficiency MATTERS. Economic downturns end when economic efficiency rebounds to the point at which more people can buy more products and a growth pattern resumes. You have to let the world adapt to growth by letting it adapt rather than by adopting ridiculous policies to push on a string.
The end game for almost all of this - including bad tax policies in some European countries, overconsumption in the US, bizarre energy policies, government overexpansion, demographic changes and world trade imbalances - is now upon us. We won't defer the time of reckoning past this year, if I am reading the freight tea leaves correctly.
Friday, June 19, 2009
Panicking

See the June RailTime report. Pdf.
This week's retail survey showed further marked declines. I'd say the drugstores are now getting hit as well.
It looks to me like all bets are off and crude is doomed to take one hell of a dive later this year. We are about two steps short of a depression.
This graph shows rail shipments of food products for 09 through May. It is the corollary to the horrible retail picture I have been seeing. Think about what this thing is saying. First, US population is probably at least stable even with an exodus of illegals. Second, food stamp allotments were increased, and over ten percent of the population is now receiving food stamps. Third, people who are very careful with their food budgets have seen about a ten percent drop in prices over the last year. Remember, this is a graph of volumes not value.
Therefore, this graph describes a massive and widely diffused shift in buying habits in grocery stores for food as well as probably poor food exports. The thing is, shipments had fallen so much in 08 that there shouldn't be much more room for declines.
Food products is a different category from grain, grain mill and farm ex grain.
Trucking continues its correlation with rail. In April, total volume of truck shipments was at 2001 levels:

Thursday, June 18, 2009
Two GOOD Signs
Power production in India is improving, and rail traffic for the two first weeks of June is improving. Other than that, all the reports are quite disappointing.
This year rail and trucking freight have been highly correlated, so the rail reports are very encouraging.
Retail still looks dismal and declining. It's going to be a challenge to get off the floor with consumers apparently retracting. One heck of a challenge.
Still reading!
Philly Fed (pdf) show continued declines, but at a much slower pace. The striking month to month increase in the current index was offset by the dour comment that this is the best since Sept 08, when the index turned positive - right before the cliff dive began.
Overall, the best one can hope for is a few positive months of GDP late in the year, but it is hard to see how we can achieve escape velocity without some stronger consumer spending when capacity utilization is so low. In the US, utility outputs dropped 3.4% from May to May. This is pretty comparable to China's and Germany's figures, which makes me utterly discount the Chinese growth meme.
However, India's 6.9% increase in electricity output is encouraging.
The fact that the cliff-diving is over for the nonce doesn't mean that growth automatically resumes. There are very different forces at work in this recession compared to normal recessions. Demographics, high debt, and a very widespread asset bubble have to be included in the calculation. Right now on the manufacturing the best guess for the rest of 2009 is more of the bottom leg of an L than a decisive upward trajectory. We haven't reached the bottom yet either.
Tuesday, June 16, 2009
There Was No Joy In Mudville 09
Well, I got up at 7:00 AM after being up until 2 AM with the dog, and dutifully read today's reports. They are pretty saggy. I've had it. After ploughing through the housing reports, which I saved for last because they were supposed to be good, I give up. I'm unplugging the phone and going back to bed.
I'm just wondering what is going to replace the green shoots rhetoric? Is Geithner going to talk about sacrificing virgins on Thursday and declare he found manna in the desert?
Tomorrow I'll give you the gross details. Executive Summary: Yuck. Blah. I think CR's very nice housing post can't be improved upon, but one look at those graphs will cure irrational exuberance for the rest of the year. The bottom line is that residential construction is still slowing relatively quickly (completions crashing, and authorized but not yet started continuing to decline) and that just piles on top of the commercial construction slowdown. In no sense can this be described as a recovery or even a bottom.
All of which wouldn't matter so much if anything else looked like it were developing lively feet, but instead concrete overshoes seem to be the spring economic fashion. UK gilts had a good auction - money is coming back into government bonds in a sign that the latest round of irrational exuberance based on green shoots rhetoric is wearing awfully thin.
Friday, June 12, 2009
Second Half Blues
Yeah, yeah, I know it's not even the second half of 2009 yet, but I've still got the second half blues.
The only thing consistently rising are confidence surveys, but the underlying detail of those is disappointing, because the surveys are rising on expectation of improvement rather than improvement.
Take consumer confidence, which appears to be based on future expectations, which appears to be based on media reports of economic expectations. However even consumer confidence has peaked and is now falling on gas prices. Oh, I know the Michigan survey eked out a minimal rise from 68.7 to 69, but that's way less than expected and other surveys have showed the beginnings of the fall already. One of them I like is RBC CASH (Cons. Attitudes and Spending by Household). RBC CASH declined 8.7 for June and is now at 34.3.
Coming into the second quarter we still had some heavy business declines. Among them, European industrial production was still falling at a nasty rate in April. I am discounting the positive Chinese news, because I will not believe those numbers until power usage starts rising and it is not rising. Even the Chinese don't believe those numbers. I don't believe the problem is the national government - I believe it is some of the regional governments who are finding ponies in dungpiles. Nobody else can see those ponies, so it is a pretty safe bet that they are allegorical ponies meant to assure the higher-ups of the local power structures' deep commitment to meet and exceed growth expectations. The official Chinese numbers have about the validity of the "saved or created" jobs-stimulus metric being advanced by the Obama administration, and are generated by a pretty similar process.
Yesterday's retail report was disappointing. Reporting about it was apparently heavily influenced by the reported car sales for May, but the figures in the report itself told a different story. From Table 1A on a month to month basis:
It appears that we have returned to last year's pattern of diversion of total spending to the basics. Price increases may produce temporary rises in retail sales indexes, but they also produce job losses and declining profits for the other segments of retail. The summer spending season did not open with a bang. Total retail sales were down 9.6% from the previous May.
In the meantime, our government spending woes are mounting rapidly. It was widely publicized that April's taxes were not sufficient to meet April's expenditures - they were over 20 billion short. This is remarkable because April is the one month the US is sure to see the deficit improve - until now. But May's Treasury receipts were 117,241 compared to outlays of 306,892 for a monthly deficit of 189,651. That's quite incredible. One does not know how to describe it. Let's just say that US mortgage rates are going to continue to trend higher.
The Fed's best hope of keeping mortgage rates the lowest possible over time is to pull a Volcker, because this isn't going to end until they make it clear that they will not allow inflation to go blooey. The problem is that raising rates, according to standard theory, is going to make the economy weaker. However that is not the way it's going to work this time, because oil is going to rise regardless of lower consumption as a hedge against a demented Congress destroying the dollar. The oil will create the weakness, and rates will rise in proportion to the expectation of deflation of the dollar's value.
The other hedge against the Congress dollar (hereby designated the DementoDollar) is the Canadian dollar (aka the loonie). To the extent hedging creates higher chargeable prices (prices for which you can sell oil to refineries who can process it and sell the products at a profit), those oil sands projects are going to open up again, which will raise investment and exports in Canada. The problem is recovering the initial cost quickly enough. Once they are mostly underway, the traveling costs should be under $45 a barrel. ($ quoted are not the DementoDollar).
Anyway, we are going to get our second half contraction through some combination of consumer/small business restraint and/or the Fed growing a pair and destroying the DementoDollar. Right now Congress has control of the currency, but once the Fed raises rates about 50 basis points, Congress loses control of the dollar. That would be politically costly for Bernanke, who probably would not be reappointed.
I'd say we'll be close to a second half decline of 1.8-2.2% so, which doesn't sound like much. But it is, on top of what we've already taken.
If the Fed doesn't seize control of the dollar, the DementoDollar will bring us another 3-4% contraction by 2011. I think I'd prefer to take my medicine now.
In the meantime, anyone who thinks that just voting for Republicans will kill the DementoDollar needs to get a grip and contemplate Isakson (R, GA), who is pushing his 15K buy a home, get a bunch of DementoDollars free program. Any home. The DementoDollar is a bipartisan effort. Needless to say, it's not much a value for the people who use the DementoDollars unless they plan to be in the house for about forever, because as soon as the Federal Government stops paying people 15K to buy a house (any house!), home prices will collapse some more. Most Georgians can't even do percents in their heads, and it appears Isakson is no exception.
I was going to post a bunch of stuff about oil and the BP 2009 report, but tomorrow. Tomorrow. Contemplating the DementoDollar has depressed me.
The only thing consistently rising are confidence surveys, but the underlying detail of those is disappointing, because the surveys are rising on expectation of improvement rather than improvement.
Take consumer confidence, which appears to be based on future expectations, which appears to be based on media reports of economic expectations. However even consumer confidence has peaked and is now falling on gas prices. Oh, I know the Michigan survey eked out a minimal rise from 68.7 to 69, but that's way less than expected and other surveys have showed the beginnings of the fall already. One of them I like is RBC CASH (Cons. Attitudes and Spending by Household). RBC CASH declined 8.7 for June and is now at 34.3.
Coming into the second quarter we still had some heavy business declines. Among them, European industrial production was still falling at a nasty rate in April. I am discounting the positive Chinese news, because I will not believe those numbers until power usage starts rising and it is not rising. Even the Chinese don't believe those numbers. I don't believe the problem is the national government - I believe it is some of the regional governments who are finding ponies in dungpiles. Nobody else can see those ponies, so it is a pretty safe bet that they are allegorical ponies meant to assure the higher-ups of the local power structures' deep commitment to meet and exceed growth expectations. The official Chinese numbers have about the validity of the "saved or created" jobs-stimulus metric being advanced by the Obama administration, and are generated by a pretty similar process.
Yesterday's retail report was disappointing. Reporting about it was apparently heavily influenced by the reported car sales for May, but the figures in the report itself told a different story. From Table 1A on a month to month basis:
Total sales: +1,571Weakness in the dollar increased many drug prices. Grocery sales were mostly real increases. Gasoline appeared to be price increases. This is really disappointing because May was favored this year due to a relatively early Memorial Day holiday and the associated vacations, plus increased auto spending due to the fact that auto dealers were in some cases desperately selling inventory before they were dumped as dealers. When the holiday is later the increase in sales is spread over the two months.
Gasoline: +986
Groceries: +180
Drugstores: +146 (subtotal 1312)
Total Auto: +261
Most other categories dropped.
It appears that we have returned to last year's pattern of diversion of total spending to the basics. Price increases may produce temporary rises in retail sales indexes, but they also produce job losses and declining profits for the other segments of retail. The summer spending season did not open with a bang. Total retail sales were down 9.6% from the previous May.
In the meantime, our government spending woes are mounting rapidly. It was widely publicized that April's taxes were not sufficient to meet April's expenditures - they were over 20 billion short. This is remarkable because April is the one month the US is sure to see the deficit improve - until now. But May's Treasury receipts were 117,241 compared to outlays of 306,892 for a monthly deficit of 189,651. That's quite incredible. One does not know how to describe it. Let's just say that US mortgage rates are going to continue to trend higher.
The Fed's best hope of keeping mortgage rates the lowest possible over time is to pull a Volcker, because this isn't going to end until they make it clear that they will not allow inflation to go blooey. The problem is that raising rates, according to standard theory, is going to make the economy weaker. However that is not the way it's going to work this time, because oil is going to rise regardless of lower consumption as a hedge against a demented Congress destroying the dollar. The oil will create the weakness, and rates will rise in proportion to the expectation of deflation of the dollar's value.
The other hedge against the Congress dollar (hereby designated the DementoDollar) is the Canadian dollar (aka the loonie). To the extent hedging creates higher chargeable prices (prices for which you can sell oil to refineries who can process it and sell the products at a profit), those oil sands projects are going to open up again, which will raise investment and exports in Canada. The problem is recovering the initial cost quickly enough. Once they are mostly underway, the traveling costs should be under $45 a barrel. ($ quoted are not the DementoDollar).
Anyway, we are going to get our second half contraction through some combination of consumer/small business restraint and/or the Fed growing a pair and destroying the DementoDollar. Right now Congress has control of the currency, but once the Fed raises rates about 50 basis points, Congress loses control of the dollar. That would be politically costly for Bernanke, who probably would not be reappointed.
I'd say we'll be close to a second half decline of 1.8-2.2% so, which doesn't sound like much. But it is, on top of what we've already taken.
If the Fed doesn't seize control of the dollar, the DementoDollar will bring us another 3-4% contraction by 2011. I think I'd prefer to take my medicine now.
In the meantime, anyone who thinks that just voting for Republicans will kill the DementoDollar needs to get a grip and contemplate Isakson (R, GA), who is pushing his 15K buy a home, get a bunch of DementoDollars free program. Any home. The DementoDollar is a bipartisan effort. Needless to say, it's not much a value for the people who use the DementoDollars unless they plan to be in the house for about forever, because as soon as the Federal Government stops paying people 15K to buy a house (any house!), home prices will collapse some more. Most Georgians can't even do percents in their heads, and it appears Isakson is no exception.
I was going to post a bunch of stuff about oil and the BP 2009 report, but tomorrow. Tomorrow. Contemplating the DementoDollar has depressed me.
Wednesday, June 10, 2009
Japan
I suspect that Japan's situation is an exaggerated reflection of the global situation.
This Bloomberg article details the problem; while most projections are for the Japanese economy to show some small growth in the second quarter, the projected declines in capital spending and the continued decline in employment make it very likely that this growth will be short-lived. The most probable outcome is for a double-dip recession, with the second dip being much slower in rate of decline but extended.
I think you should read the whole article, but here are some highlights:
For the first quarter of 2009, GDP dropped 15.2% annualized. Of course that cannot continue. That was the fourth quarter of contraction, and followed an annualized rate of contraction of 12.1% in the prior quarter. It would not be surprising to see a positive quarter or two, but failing a massive rebound (which does not seem in the cards), companies have to continue to cut investment spending and employees. This is the classic shelf effect, in which waves of contraction force other waves of contraction.
Currently, Japan seems to be entering another deflationary cycle, or perhaps sliding back into the longer cycle.
Update: Trends in India are questionable also. See this article about this spring's drop in bank credit. This is very inconsistent with the government's growth projections:
This Bloomberg article details the problem; while most projections are for the Japanese economy to show some small growth in the second quarter, the projected declines in capital spending and the continued decline in employment make it very likely that this growth will be short-lived. The most probable outcome is for a double-dip recession, with the second dip being much slower in rate of decline but extended.
I think you should read the whole article, but here are some highlights:
Bookings, an indicator of capital investment in the next three to six months, fell 5.4 percent to 688.8 billion yen ($7.1 billion) in April, the lowest since 1987, the Cabinet Office said today in Tokyo. Wholesale prices, the costs companies pay for energy and raw materials, slid 5.4 percent in May from a year earlier, the Bank of Japan said.Capacity usage around 50%? That's a major overhang, and as more jobs are cut Japanese consumer spending is weakening. Japanese workers receive major shares of their salaries in the form of bonuses, and the projection is that summer bonuses will be 19% lower this year. The survey projected about a $1,000 drop in bonuses. Japanese consumer spending is generally about 50% of the economy, and has recently fallen about 2.4%.
...
Still, only about half the nation’s factory capacity is being used, putting pressure on managers to cut costs and delay investments.
A survey published this week by the Nikkei newspaper showed that Japanese companies plan to cut capital spending by an unprecedented 15.9 percent this business year.
For the first quarter of 2009, GDP dropped 15.2% annualized. Of course that cannot continue. That was the fourth quarter of contraction, and followed an annualized rate of contraction of 12.1% in the prior quarter. It would not be surprising to see a positive quarter or two, but failing a massive rebound (which does not seem in the cards), companies have to continue to cut investment spending and employees. This is the classic shelf effect, in which waves of contraction force other waves of contraction.
Currently, Japan seems to be entering another deflationary cycle, or perhaps sliding back into the longer cycle.
Update: Trends in India are questionable also. See this article about this spring's drop in bank credit. This is very inconsistent with the government's growth projections:
Bank credit came down to 16% for the fortnight ended May 22, the lowest since March 2004. Data released by the Reserve Bank of India (RBI) Thursday last reveals that bank credit has dropped by Rs 16,306 crore.
The growth of 16% as compared to 25% in the same period last year is discouraging for the establishment which hopes of an industrial rebound after more than six months of slowdown.
The disappointment is more because the credit growth has to be around 20% if the GDP has to grow to at least 6%, according to central bank estimates.
Tuesday, June 09, 2009
Some Thoughts
Wholesale inventories and sales for April (pdf). Get Excel files here. Sales dropped only 0.4% and inventories dropped 1.4%, bringing the inventory sales ratio to 1.31. A year ago it was 1.12, so we have quite a way to go unless sales start to revive. In March it was 1.32.
From April 08 to April 09, inventories have dropped 6.2%, but sales have dropped 19.5%.
Unless sales pick up decently, this could take until the end of the year to get back to a reasonable range. I suppose that is not good news if you are hoping for the economy to return to growth this summer, but at least this ratio is dropping. The magic number here is going to be about 1.20.
Brazil's YoY GDP growth for the first quarter was reported at -1.8%.
Germany's industrial production fell 1.9% from March to April. Foreign sales fell 4.8% from March to April, which is certainly not going to be good for business projections:
When the transportation conferences are desperately talking about green madness, you know change is in the works. Since March, IATA has changed its 09 global air traffic estimate from 4.7 billion to 9 billion:
On the oil front, Total SA is looking for givebacks in costs:
The depth and global extent of this recession are unique since the 50s, so in a way one can understand the deep underestimation of its severity involved in this graph from the Obama administration's pitch for the stimulus bill (from the Innocent Bystanders blog)
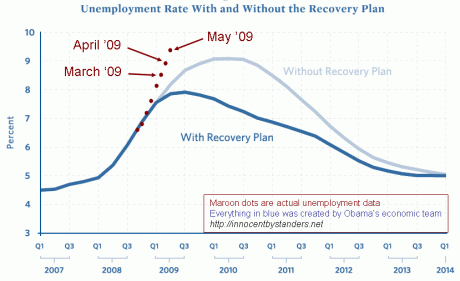
It was a little stupid to do this in the first place, because it was always likely to be one of those things that can be used against you. One can understand and forgive that. It is hard to forgive the lack of attention since to situation. The official pundits do seem a bit slow.
I'm still amazed to the point of stammering incoherence by the concept of trying to push through major healthcare reform in this environment without a careful economic projection and an assessment of costs.
Several fed governors have raised the suggestion that the US will have to raise rates late in 2009. I agree - I think the bond market is already signalling that. It's clear that it will take years to absorb the excess capacity in the system, and growth will be quite anemic until that happens. Thus, flooding the market with money will not create new investment, but instead speculation as people bid for and hold options on or actual natural resources. That would create a very negative environment for growth.
I would like to see the US administration do some analysis similar to the Deutsche Bundesbank effort here, and then have the CBO analyze various legislative initiatives under some reasonable assumptions.
From April 08 to April 09, inventories have dropped 6.2%, but sales have dropped 19.5%.
Unless sales pick up decently, this could take until the end of the year to get back to a reasonable range. I suppose that is not good news if you are hoping for the economy to return to growth this summer, but at least this ratio is dropping. The magic number here is going to be about 1.20.
Brazil's YoY GDP growth for the first quarter was reported at -1.8%.
Germany's industrial production fell 1.9% from March to April. Foreign sales fell 4.8% from March to April, which is certainly not going to be good for business projections:
“The world is still adjusting to the burst of the credit boom and this kind of hangover won’t be gone in a couple of months,” said Thorsten Polleit, chief German economist at Barclays Capital in Frankfurt. “The global economy is still lackluster.”Lackluster is an interesting word. May revenues to Egypt from traffic through the Suez Canal was down 29% YoY. In April it was down 22.7%. This confused me, because I had been reading that some of the sidelined ships had been restarted. According to this Logistics Management article, some of the ships are using roundabout routes and avoiding both the Panama and Suez Canals. Air cargo is really suffering.
When the transportation conferences are desperately talking about green madness, you know change is in the works. Since March, IATA has changed its 09 global air traffic estimate from 4.7 billion to 9 billion:
“There is no modern precedent for today’s economic meltdown,” said Giovanni Bisignani, IATA’s director general and CEO. “State of the Industry” address to 500 of the industry’s top leaders gathered in Kuala Lumpur for the 65th IATA Annual General Meeting and World Air Transport Summit, Bisignani painted a bleak picture.This is not just meaningless detail. The implication is that there will be a 4-5 year recovery process which will impact the makers of aircraft considerably. The global scope and depth of this downturn makes it particularly hard to assess. We are probably seeing and going to see more derivative effects that are most unusual and have not been felt globally since the WWII era.
Recession is the most significant factor on the industry’s bottom line, said association analysts. IATA’s revised forecast sees revenues declining an unprecedented 15 percent ($80 billion) from $528 billion in 2008 to $448 billion in 2009.
Air cargo demand is expected to decline by 17 percent. In 2009, airlines are forecast to carry 33.3 million tons of freight, compared to 40.1 million tons in 2008. Passenger demand is expected to contract by 8 percent to 2.06 billion travelers compared to 2.24 billion in 2008. The revenue impact of falling demand will be further exaggerated by large falls in yields—11 percent for cargo.
On the oil front, Total SA is looking for givebacks in costs:
Total SA, Europe’s third-largest oil producer, is seeking to cut equipment and services costs by between 20 and 30 percent as the global recession lowers energy demand, an official said.Recent oil price rises have changed matters in India:
...
The company wants bigger than targeted reductions in costs for deepwater equipment, rentals of which have surged 300 percent in the last few years, Guillermou said. Contractors should reduce costs if they want to maintain demand for rigs, he said.
“If they want the backlog to continue they have to bring cost of services and equipment back to the environment which prevailed in 2005, 2006,” he said.
Prime Minister Manmohan Singh’s government was expected to lift a 5 1/2 year cap on pump prices of automobile fuels after his re-election last month. Oil Minister Murli Deora said May 29 he planned to seek cabinet approval to free up fuel prices from state control within six weeks. Removing the curbs will enable refiners to profit from crude’s 54 percent advance this year.Most of their companies haven't even made back the prior losses. The way India has been funding this is through oil bonds, which are an off-balance sheet item.
“Petrol and diesel margins have turned negative at these oil prices, which affect the companies’ earnings and cash flows,” said Vishwas Katela, an analyst at Mumbai-based Anand Rathi Financial Services Ltd. “We don’t know what the government will do, but the chances of complete de-regulation are slim.”
The depth and global extent of this recession are unique since the 50s, so in a way one can understand the deep underestimation of its severity involved in this graph from the Obama administration's pitch for the stimulus bill (from the Innocent Bystanders blog)
It was a little stupid to do this in the first place, because it was always likely to be one of those things that can be used against you. One can understand and forgive that. It is hard to forgive the lack of attention since to situation. The official pundits do seem a bit slow.
I'm still amazed to the point of stammering incoherence by the concept of trying to push through major healthcare reform in this environment without a careful economic projection and an assessment of costs.
Several fed governors have raised the suggestion that the US will have to raise rates late in 2009. I agree - I think the bond market is already signalling that. It's clear that it will take years to absorb the excess capacity in the system, and growth will be quite anemic until that happens. Thus, flooding the market with money will not create new investment, but instead speculation as people bid for and hold options on or actual natural resources. That would create a very negative environment for growth.
I would like to see the US administration do some analysis similar to the Deutsche Bundesbank effort here, and then have the CBO analyze various legislative initiatives under some reasonable assumptions.
Monday, June 08, 2009
Busy - Substantive Blogging Tomorrow
Saturday, June 06, 2009
But This ISN'T an SNL Skit
BobN at Liberative has the story. Of course, it's really about improving their Congressional image rather than their image with the US public.
But hey, spin is in. The White House is defending itself against criticisms over its earlier economic pronouncements with spin.
Criticism:

What's bad about this is that Romer should have discussed the change in trend for temporary workers, which is a genuinely positive indicator. I did point that out.
So not only do we have spin, but we have incompetent spin.
The explanation for more people searching for work is that people who weren't working are desperate enough to come back into the marketplace. Usually these are older women forced back in as kids or husbands lose their jobs and can't get new ones. Eventually, the number of discouraged workers will fall and the discouraged workers cohort will come back into the marketplace. When jobs appear. Not before then.
My unhappiness with the "stimulus" bill wasn't political at all. It was because because less than a fourth of the stimulus even hit inside the government's expected recessionary cycle, and most of that hit right at the end of the recessionary cycle. The majority of it is due to be spent at a time when the government projected a healthily growing economy.
This meant that either the government was lying about the duration it expected for this recession, or that it was using the recession as a pretext to pursue its own goals, or that it was just incompetent. Your guess is as good as mine. My guess is that Obama's team looked at the average duration of US recessions and told him that this thing was almost over, which explained why the administration claimed stimulus bill was so urgently needed that Congress wasn't even allowed to read the darned thing before voting on it. In other words, incompetence.
I told you the darned report was depressing. I found it so darned depressing that I didn't even want to quote the worst parts, which have been duly included above. The number of temporary job losers should have been inflated by the effects of the census jobs' completion, so hopefully it is not as bad as it looks. But it is unequivocally BAD.
Yesterday I was thinking to myself, "Hey, it's Friday, we could all use a break, and I don't want anyone to blow their brains out because they are reading my blog." But on the other hand, real life is not an SNL skit, and when the government is spewing such nonsense it should be exposed. They ought to at least feel the need to lie convincingly.
So here's the last bit of bad employment news, which I hinted at in yesterday's May employment post, but did not explain. The outlying figure was the establishment survey. Not only did it report job losses of only 345 jobs, but the figures for the prior months were revised up. Could this have anything at all to do with a B/D adjustment which added 319 thousand jobs in May? Hmm, possibly it could.
If you are wondering why this bright and chipper adjustment occurred, it is not due to a government conspiracy. Instead, it is due to the methodology for the B/D survey, which depends on the Business Employment Dynamics Survey, which is always more than half a year behind. Thus the adjustments for the current period are derived from employment data from last year, before the steep decline in the economy began. And not only that, last year GDP for the second and third quarters was substantially boosted by a very large stimulus bill which was in fact dumped immediately into the economy, which played a big part in creating a pattern of rising GDP through the first part of a recession (which is a neat trick, but can be accomplished if you are prepared to throw enough money directly into the hands of cash-strapped consumers):

Thus, the data BLS is using to produce the establishment survey B/D component has nothing to do with current conditions. There is a reason why they publish both the household and establishment survey. They will go back and revise the establishment data as they get better data, and eventually it will be pretty darned good. One would think that someone like Christina Romer would have to know this sort of thing to be Chair of the White House Council of Economic Advisors, but instead it is clear that she didn't even read the darned employment report before spinning it. Is she in that position because she has boobs, and for no other reason? I think not, because although the economic pundit profession is skewed toward males, there are quite of few women in it, and most of them are very good. I think it is because she is the type of person who doesn't read the reports before commenting on them.
Yesterday's report is also depressing because it matches well with my retail survey, which I discussed in some deep angst exactly two months ago, and with the continued dire nature of the rail reports. Due to my campaign to prevent a rash of Friday blog reader suicides, I also did not publish the rail data.
If you are feeling depressed, exit this post now and do not read the comments. I will put the rail data in the comments in deference to civility and my hopes that you will have a good weekend.
The sun finally came out here after a week of rain, or otherwise I wouldn't be writing about this stuff at all.
But hey, spin is in. The White House is defending itself against criticisms over its earlier economic pronouncements with spin.
Criticism:
Republicans noted that a report by the Obama transition team in early January said that without a large stimulus plan, unemployment would go above 9%. It is now above that level, despite passage of the stimulus plan, though less than 5% of funds have been spent.Spin:
Christina Romer, chairman of the White House Council of Economic Advisers, countered that she saw some positive developments in the numbers. The Labor Department reported Friday that job losses slowed to 345,000 -- the first time in six months that monthly payroll losses have been less than a half-million. And for the second month in a row, the labor force actually grew. That helped drive the unemployment rate up, but it also suggested more people are feeling positive enough about the economy to look for work.Fair enough, except this response is flatly contradicted the household survey's much higher number of unemployed workers:
Among the unemployed, the number of job losers and persons who completed temporary jobs rose by 732,000 in May to 9.5 million.and by the steep rise in discouraged workers in recent months:

What's bad about this is that Romer should have discussed the change in trend for temporary workers, which is a genuinely positive indicator. I did point that out.
So not only do we have spin, but we have incompetent spin.
The explanation for more people searching for work is that people who weren't working are desperate enough to come back into the marketplace. Usually these are older women forced back in as kids or husbands lose their jobs and can't get new ones. Eventually, the number of discouraged workers will fall and the discouraged workers cohort will come back into the marketplace. When jobs appear. Not before then.
My unhappiness with the "stimulus" bill wasn't political at all. It was because because less than a fourth of the stimulus even hit inside the government's expected recessionary cycle, and most of that hit right at the end of the recessionary cycle. The majority of it is due to be spent at a time when the government projected a healthily growing economy.
This meant that either the government was lying about the duration it expected for this recession, or that it was using the recession as a pretext to pursue its own goals, or that it was just incompetent. Your guess is as good as mine. My guess is that Obama's team looked at the average duration of US recessions and told him that this thing was almost over, which explained why the administration claimed stimulus bill was so urgently needed that Congress wasn't even allowed to read the darned thing before voting on it. In other words, incompetence.
I told you the darned report was depressing. I found it so darned depressing that I didn't even want to quote the worst parts, which have been duly included above. The number of temporary job losers should have been inflated by the effects of the census jobs' completion, so hopefully it is not as bad as it looks. But it is unequivocally BAD.
Yesterday I was thinking to myself, "Hey, it's Friday, we could all use a break, and I don't want anyone to blow their brains out because they are reading my blog." But on the other hand, real life is not an SNL skit, and when the government is spewing such nonsense it should be exposed. They ought to at least feel the need to lie convincingly.
So here's the last bit of bad employment news, which I hinted at in yesterday's May employment post, but did not explain. The outlying figure was the establishment survey. Not only did it report job losses of only 345 jobs, but the figures for the prior months were revised up. Could this have anything at all to do with a B/D adjustment which added 319 thousand jobs in May? Hmm, possibly it could.
If you are wondering why this bright and chipper adjustment occurred, it is not due to a government conspiracy. Instead, it is due to the methodology for the B/D survey, which depends on the Business Employment Dynamics Survey, which is always more than half a year behind. Thus the adjustments for the current period are derived from employment data from last year, before the steep decline in the economy began. And not only that, last year GDP for the second and third quarters was substantially boosted by a very large stimulus bill which was in fact dumped immediately into the economy, which played a big part in creating a pattern of rising GDP through the first part of a recession (which is a neat trick, but can be accomplished if you are prepared to throw enough money directly into the hands of cash-strapped consumers):
Thus, the data BLS is using to produce the establishment survey B/D component has nothing to do with current conditions. There is a reason why they publish both the household and establishment survey. They will go back and revise the establishment data as they get better data, and eventually it will be pretty darned good. One would think that someone like Christina Romer would have to know this sort of thing to be Chair of the White House Council of Economic Advisors, but instead it is clear that she didn't even read the darned employment report before spinning it. Is she in that position because she has boobs, and for no other reason? I think not, because although the economic pundit profession is skewed toward males, there are quite of few women in it, and most of them are very good. I think it is because she is the type of person who doesn't read the reports before commenting on them.
Yesterday's report is also depressing because it matches well with my retail survey, which I discussed in some deep angst exactly two months ago, and with the continued dire nature of the rail reports. Due to my campaign to prevent a rash of Friday blog reader suicides, I also did not publish the rail data.
If you are feeling depressed, exit this post now and do not read the comments. I will put the rail data in the comments in deference to civility and my hopes that you will have a good weekend.
The sun finally came out here after a week of rain, or otherwise I wouldn't be writing about this stuff at all.
Friday, June 05, 2009
Consumer Credit G.19
| 2008 | 2009 | ||||||||||||
|---|---|---|---|---|---|---|---|---|---|---|---|---|---|
| 2004 | 2005 | 2006 | 2007 | 2008 | Q1 | Q2 | Q3 | Q4 r | Q1 r | Feb r | Mar r | Apr p | |
| Percent change at annual rate 2 | |||||||||||||
| Total | 5.5 | 4.3 | 4.5 | 5.5 | 1.7 | 4.8 | 3.9 | 1.3 | -3.2 | -3.5 | -5.1 | -7.8 | -7.4 |
| Revolving | 3.8 | 3.1 | 6.1 | 7.4 | 2.3 | 7.6 | 3.5 | 4.6 | -6.5 | -8.9 | -13.9 | -11.2 | -11.0 |
| Nonrevolving 3 | 6.4 | 4.9 | 3.6 | 4.4 | 1.4 | 3.1 | 4.2 | -0.6 | -1.1 | -0.3 | 0.2 | -5.8 | -5.3 |
| Amount: billions of dollars | |||||||||||||
| Total | 2191.6 | 2285.2 | 2387.7 | 2519.0 | 2562.3 | 2549.0 | 2574.1 | 2582.8 | 2562.3 | 2539.7 | 2556.2 | 2539.7 | 2524.0 |
| Revolving | 799.8 | 824.5 | 874.6 | 939.5 | 960.9 | 957.3 | 965.8 | 976.8 | 960.9 | 939.6 | 948.4 | 939.6 | 931.0 |
| Nonrevolving 3 | 1391.8 | 1460.7 | 1513.1 | 1579.5 | 1601.4 | 1591.7 | 1608.3 | 1606.0 | 1601.4 | 1600.1 | 1607.8 | 1600.1 | 1593.0 |
These numbers get revised, but this is enough to show the trend. This is the seasonally adjusted version. Note that revolving credit was paid down heavily in February and March. That is from households using their tax refunds to pay.
The rest is both writeoffs and payoffs. Until this ends, the consumer side of the economy is set to keep declining. As revolving credit growth slowed in 2008, so did sales. Now that people are forced to buckle down and pay it off, things look to continue slow.
This release contains data on credit given to consumers by commercial banks and finance companies that is not secured by real estate.
Update: Oh, gee, it might be nice if I gave y'all a link to the actual report, huh? My only excuse is that I am very excited. Chief Metalheart returned home from the doctor, covered in glory and brandishing some pretty sterling test results. He has been behaving. When my own thankful heart stops throbbing I'll actually post something useful I did a while ago.
Jobs For May
By M_O_M metrics, which are often a bit different than the standard, this was one very depressing employment report. There was one bright note - temporary employment improved:
Most analysts pay attention to the establishment survey numbers, considering them more reliable than the household survey. I do the reverse. It is true that the household survey pops around from month to month, but the establishment survey has the Birth/Death issue, and its seeming continuity is, IMO, a fake produced by those adjustments. This is not intended to be an indictment of the establishment survey - I think BLS does a good job. However those numbers are heavily revised, because the B/D adjustments are based on data from about 3/4 of a year ago. Ultimately these numbers end up being reliable, but they aren't that reliable when first released when the economy is in a period of rapid change.
Last month there was tentative hope on the household survey (as Mark noted, total employment rose by 120,000). This month that reversed to a loss of 437,000 jobs. Household survey unemployment rose by 787,000, giving us a March to May rise in unemployment of 1.35 million. Slightly less than half (667,000) of that was due to a drop in the "not-in-labor-force" cohort. BLS figures 792,000 discouraged workers (not looking for a job because there are none). That would take total real unemployment to over 15 million even allowing for substantial error.
The establishment survey reported only 345,000 jobs lost in May, which is leading to a lot of optimism. But I am highly skeptical - the two surveys are showing opposite results for the last two months, and therefore I find it hard to accept today's report as demonstrating a trend.
I would be pretty certain that we were well into the readaptation phase of a recession, in which enough businesses have retracted and pulled out to create opportunity for other, stronger businesses to expand, except for two factors. One is retail store traffic, which just seems dismal and degenerating. The second is that the impact of the auto industry reorganization has yet to truly show. I doubt we will know until August how successful we have been at forming a floor in the business segment of the economy. Consumer spending will probably continue to drag after that, but at least we'd know that most of the restructuring was over (aside from government policy changes) and then we could effectively project a date at which we were certain that consumer spending would stop falling because of the debt trajectory.
I think retail/mall/hotel/resort/government job losses are going to continue to mount regardless. One of the differences in this recession compared to the recessioins of the 90s and early 2000s is that it is not just a private restructuring but a state and local government restructuring that must occur. This recession will be more similar to the 80s than the last two.
Only this time, it will not be Bruce Springsteen singing about steel mills shutting down. The Bruce Springsteen of this recession will be declaiming poetry in a Berkeley coffee house about the loss of government and education jobs. This time, the professors, teachers and government-union workers will feel it. The social changes that will eventually emerge from this recession will be immense. Our national ways of doing things are going to change quite radically, and it will not be in the direction that our president has promised. Regardless of which party eventually gains nominal hold of the federal government, the dual trend sof increasing government share of the economy and increasing consumption share of the economy are gasping out their last breaths. The only way to increase government share is to hike taxes massively on more than half of the US population. This will not sit well.
Consumer credit is due to be released this afternoon. That is the report for which I am holding my breath.
Update: Also see Across the Curve's post on the DB analysis, which includes more of the negatives in the establishment survey.
The temporary help services industry, which had been dropping an average of 73,000 jobs per month over this period, saw little employment change in May (-7,000).Let's hope that is real.
Most analysts pay attention to the establishment survey numbers, considering them more reliable than the household survey. I do the reverse. It is true that the household survey pops around from month to month, but the establishment survey has the Birth/Death issue, and its seeming continuity is, IMO, a fake produced by those adjustments. This is not intended to be an indictment of the establishment survey - I think BLS does a good job. However those numbers are heavily revised, because the B/D adjustments are based on data from about 3/4 of a year ago. Ultimately these numbers end up being reliable, but they aren't that reliable when first released when the economy is in a period of rapid change.
Last month there was tentative hope on the household survey (as Mark noted, total employment rose by 120,000). This month that reversed to a loss of 437,000 jobs. Household survey unemployment rose by 787,000, giving us a March to May rise in unemployment of 1.35 million. Slightly less than half (667,000) of that was due to a drop in the "not-in-labor-force" cohort. BLS figures 792,000 discouraged workers (not looking for a job because there are none). That would take total real unemployment to over 15 million even allowing for substantial error.
The establishment survey reported only 345,000 jobs lost in May, which is leading to a lot of optimism. But I am highly skeptical - the two surveys are showing opposite results for the last two months, and therefore I find it hard to accept today's report as demonstrating a trend.
I would be pretty certain that we were well into the readaptation phase of a recession, in which enough businesses have retracted and pulled out to create opportunity for other, stronger businesses to expand, except for two factors. One is retail store traffic, which just seems dismal and degenerating. The second is that the impact of the auto industry reorganization has yet to truly show. I doubt we will know until August how successful we have been at forming a floor in the business segment of the economy. Consumer spending will probably continue to drag after that, but at least we'd know that most of the restructuring was over (aside from government policy changes) and then we could effectively project a date at which we were certain that consumer spending would stop falling because of the debt trajectory.
I think retail/mall/hotel/resort/government job losses are going to continue to mount regardless. One of the differences in this recession compared to the recessioins of the 90s and early 2000s is that it is not just a private restructuring but a state and local government restructuring that must occur. This recession will be more similar to the 80s than the last two.
Only this time, it will not be Bruce Springsteen singing about steel mills shutting down. The Bruce Springsteen of this recession will be declaiming poetry in a Berkeley coffee house about the loss of government and education jobs. This time, the professors, teachers and government-union workers will feel it. The social changes that will eventually emerge from this recession will be immense. Our national ways of doing things are going to change quite radically, and it will not be in the direction that our president has promised. Regardless of which party eventually gains nominal hold of the federal government, the dual trend sof increasing government share of the economy and increasing consumption share of the economy are gasping out their last breaths. The only way to increase government share is to hike taxes massively on more than half of the US population. This will not sit well.
Consumer credit is due to be released this afternoon. That is the report for which I am holding my breath.
Update: Also see Across the Curve's post on the DB analysis, which includes more of the negatives in the establishment survey.
Thursday, June 04, 2009
Thoughtful Thursday?
More bright and chipper headlines on the weekly unemployment report. Once again, I don't see the justification. Last week's claims were revised up, so the real drop in this week's claims was 2,000 (623,000 to 621,000). The four week moving average for initial claims increased this week, which I wouldn't consider a positive sign, as did the four week moving average for continued claims.
But truthfully, until we know what the impact of the car bankruptcies is, any speculation about employment is premature.
Also, this is the time when the closing of schools, colleges and universities for summer break causes heavier than normal seasonal adjustments, and introduces high volatility into the weekly unemployment reports, because small changes in calendar mess up the standard seasonal adjustments. By the end of June we'll know more. Monster's index is moving down a bit. The Conference Board's online index rose in May (see pdf report here), although job postings remained down 25% YoY.
Treasury FUT reported for May was just awful - an adjusted 190 vs last May's 235. April was much better, which may indicate more stability in small business employment. However this week's ADP data shows that small businesses are still shedding jobs, which is worrisome. I know big businesses are!
The retail data coming in is mostly pretty poor. Walmart is still good. Costco -7% on same store sales. CNN headlines May retail sales as "soggy". Isn't it supposed to be "April showers make May flowers?" The article notes that reports of higher consumer confidence are not translating into sales at stores:

Tomorrow we get the May employment report, plus consumer credit in the afternoon. I'm very curious about consumer credit.
For your amusement, an article about the CA automobile emissions requirements:
I would think the best possibility is in very small electric urban commuting vehicles. We'll see. Right now consumer spending in the US is heavily linked with gasoline prices. You have to put very high mileage indeed on a vehicle to recover 20K in capital cost on the difference between miles powered by electricity vs miles powered by gasoline. If gas costs $3 per gallon, the cost to run a mile in a gas-powered vehicle with 30 mpg is 10 cents. Let's assume the all-electric car costs you 0 cents per mile (which is not quite true). To recover 20K over the lifetime of the car, you have to run it 200,000 miles. However, you are paying the capital cost of that efficiency up front. Suppose you put 40K miles on the vehicle per year - it will take you 5 years to recover your initial investment. .
But you really aren't even breaking even, because if you had that 20K in a CD for 5 years at 3%, you'd still wind up more than 3K richer after 5 years with the conventional vehicle. Alternatively, if you finance the extra 20K at 5% over 5 years, the payment would be around $377.00 monthly. To break even each month, you'd have to run the car 3,770 miles a month, or 45,240 miles a year. In addition, there would be a higher insurance cost. It's very difficult right now to make an all-electric vehicle pay, although I think the hybrids do show a profit as taxis.
California gets stranger every month due to its numerically-impaired politics. It's a special state running in the special state bankruptcy Olympics.
But then the feds really aren't much better when it comes to numbers.
In 2007, according to Pew, the adult Muslim population of the US was around 1.4 million, which surely makes the total population less than 2 million. But I woke up in 2009 in a US, according to our president, which is one of the largest Muslim countries in the world. It's all so special.
I like Obama as a person, and I think he has high ideals. But when Friedman writes a column quoting this Obama statement:
So why does he have to trip himself up with a falsehood? I don't think he meant to do it, but this is an administration (Congress and the Executive) that seems to have a fragile relationship with facts. I am not sure that Obama believes facts are important. He believes the narrative structures the future. I do not. If the narrative structured the future, the average US homeowner would be a millionaire by now.
But truthfully, until we know what the impact of the car bankruptcies is, any speculation about employment is premature.
Also, this is the time when the closing of schools, colleges and universities for summer break causes heavier than normal seasonal adjustments, and introduces high volatility into the weekly unemployment reports, because small changes in calendar mess up the standard seasonal adjustments. By the end of June we'll know more. Monster's index is moving down a bit. The Conference Board's online index rose in May (see pdf report here), although job postings remained down 25% YoY.
Treasury FUT reported for May was just awful - an adjusted 190 vs last May's 235. April was much better, which may indicate more stability in small business employment. However this week's ADP data shows that small businesses are still shedding jobs, which is worrisome. I know big businesses are!
The retail data coming in is mostly pretty poor. Walmart is still good. Costco -7% on same store sales. CNN headlines May retail sales as "soggy". Isn't it supposed to be "April showers make May flowers?" The article notes that reports of higher consumer confidence are not translating into sales at stores:
The jump in consumer confidence numbers in May had raised hopes of a much-need rebound in consumer spending, which is responsible for fueling two-thirds of the nation's economy.Well, as I noted in an earlier post, the rise in consumer confidence was due to hopes for the future, rather than due to a change in current conditions. Did this set of survey results ever justify an expectation that retail sales would rebound?
But that did not materialize.
...
Sales tracker Thomson Reuters, which tracks monthly same-sales for 30 retail chains, said overall May sales for the group fell a worse-than-expected 4.8%, compared to a gain of 1.1% last year.
Consumers' overall assessment of current-day conditions improved again. Those claiming business conditions are "good" increased to 8.7 percent from 7.9 percent. However, those claiming conditions are "bad" increased to 45.3 percent from 44.9 percent. Consumers' appraisal of the job market was also more favorable. Those claiming jobs are "hard to get" decreased to 44.7 percent from 46.6 percent in April. Those saying jobs are "plentiful" edged up to 5.7 percent from 4.9 percent.I think we must be more realistic. When at least 30% of the consumers feel that current conditions are improving, we can hope for better retail data. Right now more consumers believe hiring will worsen in the near future than believe that hiring will improve in the near future. Then too, rising gas prices are going to be inducing conservative spending attitudes in lower-income consumers. That's a crunch they feel immediately, and it certainly is going to worry them over the summer:
Consumers' short-term outlook improved significantly in May. Those expecting business conditions will improve over the next six months increased to 23.1 percent from 15.7 percent, while those anticipating conditions will worsen declined to 17.8 percent from 24.4 percent in April.
The employment outlook was also less pessimistic. The percentage of consumers expecting more jobs in the months ahead increased to 20.0 percent from 14.2 percent, while those anticipating fewer jobs decreased to 25.2 percent from 32.5 percent. The proportion of consumers anticipating an increase in their incomes edged up to 10.2 percent from 8.3 percent.
Tomorrow we get the May employment report, plus consumer credit in the afternoon. I'm very curious about consumer credit.
For your amusement, an article about the CA automobile emissions requirements:
California’s requirement for plug-ins and zero-pollution models applies only to companies that sell at least 60,000 vehicles a year in the state. General Motors Corp. and Chrysler LLC’s bankruptcies may cut their sales in the state, reducing the costs of compliance.The projected cost of most of these zero-emissions vehicles I have seen so far are upwards of 40K. That's going to be a hard sell for everything except governments. But wait! Does anyone think that CA governments won't still be cash-strapped when 2012 rolls around?
“The targets of the rule initially would have been GM, Ford and Chrysler because of all their trucks, not Honda and Toyota, which are kind of the environmental darlings,” said Jim Hossack, an analyst at consulting firm AutoPacific Inc. in Tustin, California. “It’s ironic those two companies could take the biggest hit.”
...
Toyota this month said U.S. demand for plug-ins may be much smaller than advocates suggest. Bill Reinert, Toyota’s U.S. national manager for advanced technology, told a National Academy of Sciences panel in Washington May 18 that a market for such vehicles may be 50,000 units a year at most and as few as 3,500.
I would think the best possibility is in very small electric urban commuting vehicles. We'll see. Right now consumer spending in the US is heavily linked with gasoline prices. You have to put very high mileage indeed on a vehicle to recover 20K in capital cost on the difference between miles powered by electricity vs miles powered by gasoline. If gas costs $3 per gallon, the cost to run a mile in a gas-powered vehicle with 30 mpg is 10 cents. Let's assume the all-electric car costs you 0 cents per mile (which is not quite true). To recover 20K over the lifetime of the car, you have to run it 200,000 miles. However, you are paying the capital cost of that efficiency up front. Suppose you put 40K miles on the vehicle per year - it will take you 5 years to recover your initial investment. .
But you really aren't even breaking even, because if you had that 20K in a CD for 5 years at 3%, you'd still wind up more than 3K richer after 5 years with the conventional vehicle. Alternatively, if you finance the extra 20K at 5% over 5 years, the payment would be around $377.00 monthly. To break even each month, you'd have to run the car 3,770 miles a month, or 45,240 miles a year. In addition, there would be a higher insurance cost. It's very difficult right now to make an all-electric vehicle pay, although I think the hybrids do show a profit as taxis.
California gets stranger every month due to its numerically-impaired politics. It's a special state running in the special state bankruptcy Olympics.
But then the feds really aren't much better when it comes to numbers.
In 2007, according to Pew, the adult Muslim population of the US was around 1.4 million, which surely makes the total population less than 2 million. But I woke up in 2009 in a US, according to our president, which is one of the largest Muslim countries in the world. It's all so special.
I like Obama as a person, and I think he has high ideals. But when Friedman writes a column quoting this Obama statement:
“We have a joke around the White House,” the president said. “We’re just going to keep on telling the truth until it stops working — and nowhere is truth-telling more important than the Middle East.”But Obama has a great truth to tell about Muslims in the US, and that great truth doesn't need to rely on a falsehood. The US Constitution entirely protects Muslims. It protects their right to follow their religion and customs. There aren't unwritten social barriers to Muslims either - as the Pew study noted, Muslims in the US have similar incomes as the general population, and similar educational levels. The high degree of assimilation and advancement in the US is very dissimilar to trends in most European countries.
So why does he have to trip himself up with a falsehood? I don't think he meant to do it, but this is an administration (Congress and the Executive) that seems to have a fragile relationship with facts. I am not sure that Obama believes facts are important. He believes the narrative structures the future. I do not. If the narrative structured the future, the average US homeowner would be a millionaire by now.
Wednesday, June 03, 2009
Weak Wednesday
Excited jabber about green shoots has been going on since the snow first started melting, but as the spring wears on, the weeds look less edible. Anyone who has ever tried living off dandelion salad will understand why.
Briefly:
MBA mortgage apps: Surprising no one, they are declining as mortgage rates increase. Purchase apps are still up a bit, but refi apps are falling off sharply. Refis are an important source of income for banks.
The home sales situation around the nation varies hugely right now. If prices were quite high in an area, and if ownership rates were below 63%, there is real buying interest. In some areas, prices have not yet fallen that much, and ownership rates were too high to have seen a jump. Overall, there is a massive slew of hidden inventory, as well as an incoming wave Alt-A and economically-spawned foreclosures and forced sales. Recovery will surely not come nationally until after 2010.
Commercial RE: Building is going to slide throughout the year and probably through next year. See Calculated Risk for analysis, but this will be a continuing drag for the economy for over a year more. My guess is that in some areas CRE will be dead for another 3 years. Commercial mortgages, on the other hand, are blossoming with nuclear mushroom clouds. CM losses will keep rising for over a year.
ISM Services: This is a negative surprise that does not square with manufacturing. The headline number is that it increased from 43.7 to 44.0, but the underlying details are more negative than last month's report. Inventory sentiment was unchanged at 62.5% (too high). Inventories were reported declining more slowly. Backlog of orders dropped from 44 to 40. New export orders dropped from 48.5 to 47. New orders dropped from 47 to 44.4. Employment is still declining, and although the pace is reported as slowing, at 39 it is declining pretty heftily.
I don't think most sober analysts would see this as an improvement over last month, which suggests yet another drawback in the Congressional proposals to raise taxes on liquor. Since most confidence surveys are rising not on the basis of current conditions, but on the basis of hopes for the future, Congress really needs drunken, cheerful analysts to keep talk of green shoots alive. Perhaps the next installment of the Economic Recovery Act could include a proposal to hand out free liquor to economic analysts. (Full disclosure: I am as close as you can get to a teetotaller as you can get without actually never drinking, so I am not talking my book here.)
ADP employment survey (pdf): The headline number of 532,000 showed a slight decrease in job losses, but that was only because the March/April number was revised up some 54,000 from 491,000 to a decline of 545,000. Not even the drunken analysts took this as being a good omen, because it is likely this one too will be revised upward. More worrisome, small business job losses are cranking right along.
Preliminary manufacturers shipments and inventories remained in the "still sagging" range. Shipments of manufactured non-durables are declining still. The inventories/shipments ratio is only down to 1.45 from March's 1.46. That suggests quite a few more months of catch-up and overall contraction. Revisions from advance were generally negative.
NACM Credit Manager's Index: Because this is business-to-business credit, it should show a decisive pop when things start breaking loose. I looked at this report very carefully, after reading some positive commentary at the beginning. I was disappointed by the underlying details. The last two months have shown improvement from the nuclear winter numbers of January, February and March, but levels of new credit and new apps are not at the point at which they would justify talk of stabilization. For manufacturing, the index of unfavorable factors has remained steady for three months, and the index of favorable factors has remained steady for two months.
Services, on the other hand, did show the healthy pop in new apps and amount of credit extended that I look for each month. However, given that services follow manufacturing, this seems to be attributable to the earlier pickup in manufacturing which appeared to have stalled out in this report. So unless manufacturing can pick up again, services is unlikely to keep showing this favorable trend, and will just stabilize at a slower rate of decline to match manufacturing. Both service and manufacturing overall indices remain in the contracting levels. I am somewhat discounting the overall levels because the need for credit in relationship to economic activity should have decreased due to falling prices. According to this report, we are doomed to a slack summer through August.
Crude oil: Today's inventory report continues the unrelieved string of slack and slowly worsening demand. The four-week average of crude imported. is still about 9 million barrels a day. That is about 693 thousand barrels a day below last year. Total stocks, excluding SPR, are at 13.8% above last year's levels. Crude stocks are 20.3% above last year's levels. A quote:
I think the decline of crude is related to negative comments about the Euro from some analysts, OPEC figures, and China's somewhat dour comments about its economic prospects. See this Bloomberg article on China's comments:
Thus, crude oil at these prices may be a very risky investment, but it does contain the theoretical chance of much better returns than on "safe" investments, and it may well contain less risk. This is the danger you create when you let the government pick winners and losers - you make it difficult to calculate risk, and thus drive speculation in untested and unknowable markets. Few investors with substantial funds won't be worrying over the questions raised by 5 months of this administration's (including Congress!) financial activities. This started last year with the nationalization of Fannie and Freddie in order to stuff them with bad debt from the banks and investment houses, but this year's deeds (including legislative clauses to abrogate protections in bond servicing agreements) have added a new level of risk to all such obligations.
Update: Regarding the threat to investors, CA serves once again as the leading edge of the next trend. See Rob Dawg's post on the recent moves in the CA legislature regarding municipal bankruptcies and unions.
Briefly:
MBA mortgage apps: Surprising no one, they are declining as mortgage rates increase. Purchase apps are still up a bit, but refi apps are falling off sharply. Refis are an important source of income for banks.
The home sales situation around the nation varies hugely right now. If prices were quite high in an area, and if ownership rates were below 63%, there is real buying interest. In some areas, prices have not yet fallen that much, and ownership rates were too high to have seen a jump. Overall, there is a massive slew of hidden inventory, as well as an incoming wave Alt-A and economically-spawned foreclosures and forced sales. Recovery will surely not come nationally until after 2010.
Commercial RE: Building is going to slide throughout the year and probably through next year. See Calculated Risk for analysis, but this will be a continuing drag for the economy for over a year more. My guess is that in some areas CRE will be dead for another 3 years. Commercial mortgages, on the other hand, are blossoming with nuclear mushroom clouds. CM losses will keep rising for over a year.
ISM Services: This is a negative surprise that does not square with manufacturing. The headline number is that it increased from 43.7 to 44.0, but the underlying details are more negative than last month's report. Inventory sentiment was unchanged at 62.5% (too high). Inventories were reported declining more slowly. Backlog of orders dropped from 44 to 40. New export orders dropped from 48.5 to 47. New orders dropped from 47 to 44.4. Employment is still declining, and although the pace is reported as slowing, at 39 it is declining pretty heftily.
I don't think most sober analysts would see this as an improvement over last month, which suggests yet another drawback in the Congressional proposals to raise taxes on liquor. Since most confidence surveys are rising not on the basis of current conditions, but on the basis of hopes for the future, Congress really needs drunken, cheerful analysts to keep talk of green shoots alive. Perhaps the next installment of the Economic Recovery Act could include a proposal to hand out free liquor to economic analysts. (Full disclosure: I am as close as you can get to a teetotaller as you can get without actually never drinking, so I am not talking my book here.)
ADP employment survey (pdf): The headline number of 532,000 showed a slight decrease in job losses, but that was only because the March/April number was revised up some 54,000 from 491,000 to a decline of 545,000. Not even the drunken analysts took this as being a good omen, because it is likely this one too will be revised upward. More worrisome, small business job losses are cranking right along.
Preliminary manufacturers shipments and inventories remained in the "still sagging" range. Shipments of manufactured non-durables are declining still. The inventories/shipments ratio is only down to 1.45 from March's 1.46. That suggests quite a few more months of catch-up and overall contraction. Revisions from advance were generally negative.
NACM Credit Manager's Index: Because this is business-to-business credit, it should show a decisive pop when things start breaking loose. I looked at this report very carefully, after reading some positive commentary at the beginning. I was disappointed by the underlying details. The last two months have shown improvement from the nuclear winter numbers of January, February and March, but levels of new credit and new apps are not at the point at which they would justify talk of stabilization. For manufacturing, the index of unfavorable factors has remained steady for three months, and the index of favorable factors has remained steady for two months.
Services, on the other hand, did show the healthy pop in new apps and amount of credit extended that I look for each month. However, given that services follow manufacturing, this seems to be attributable to the earlier pickup in manufacturing which appeared to have stalled out in this report. So unless manufacturing can pick up again, services is unlikely to keep showing this favorable trend, and will just stabilize at a slower rate of decline to match manufacturing. Both service and manufacturing overall indices remain in the contracting levels. I am somewhat discounting the overall levels because the need for credit in relationship to economic activity should have decreased due to falling prices. According to this report, we are doomed to a slack summer through August.
Crude oil: Today's inventory report continues the unrelieved string of slack and slowly worsening demand. The four-week average of crude imported. is still about 9 million barrels a day. That is about 693 thousand barrels a day below last year. Total stocks, excluding SPR, are at 13.8% above last year's levels. Crude stocks are 20.3% above last year's levels. A quote:
Total products supplied over the last four-week period has averaged 18.2 millionDiesel demand has increased, and my bet is that is increasing due to higher stocking levels of businesses and households for heating purposes. Trucking may be picking up too (we certainly hope so!), which would be a positive. Crude has fallen sharply today. In the last week, it was reported that OPEC was pumping more, and real consumption figures of oil do not support much in the way of higher prices. So far this year, a YoY comparison shows product supplied down 6%. Since there are no real shortages anywhere (for example, diesel stocks are up 33.8% over last year's), the speculative part of this run doesn't have much oomph behind it. That doesn't mean it won't continue.
barrels per day, down by 7.7 percent compared to the similar period last year.
Over the last four weeks, motor gasoline demand has averaged about 9.2 million
barrels per day, down by 0.4 percent from the same period last year. Distillate
fuel demand has averaged about 3.6 million barrels per day over the last four
weeks, down by 8.8 percent from the same period last year. Jet fuel demand is
11.7 percent lower over the last four weeks compared to the same four-week
period last year.
I think the decline of crude is related to negative comments about the Euro from some analysts, OPEC figures, and China's somewhat dour comments about its economic prospects. See this Bloomberg article on China's comments:
China’s government said unemployment is worsening, a quick rebound in trade is becoming less likely, and the nation is yet to feel the full effects of a global slump.That pretty much knocks the slats out from any theory that China will be taking up the slack in oil demand from Europe and the US. I do not necessarily think that the run up in oil is over, though. The reason why is contained in the mutterings of anxious US investors over choices the current administration has recently made with regard to corporate debt holders. The fear of being wiped out by the government in other investments may well be overweighing the weak demand/supply situation. If you are wrong 25%, that's better than the risk of being wiped out 50% by an activist government with a deficit of common sense:
The foundations for an economic recovery aren’t solid, the State Council said in a statement on a government Web site today. Trade faces “unprecedented difficulties,” Vice Commerce Minister Zhong Shan said separately.
The government’s approach to the bankruptcies of General Motors Corp. and Chrysler LLC illustrates how this new, unstated policy works: Bondholders are told to give up legal rights, and cash, as part of a government-mandated tradeoff that favors a politically connected special-interest group.The obvious answer is "yes".
The big threat is that this policy will extend to all bonds, including Treasury and municipal debt, not just corporate obligations.
...
Einhorn raised the question of just how far the administration would go in pursuing this new policy, especially if the interests of bondholders again came into conflict with politically favored groups.
“When teachers and firefighters are losing jobs and benefits, will municipal bondholders be asked to share in the collective sacrifice?” he asked. “Might the shared-sacrifice theory eventually extend into the U.S. Treasury market during a crisis?”
Thus, crude oil at these prices may be a very risky investment, but it does contain the theoretical chance of much better returns than on "safe" investments, and it may well contain less risk. This is the danger you create when you let the government pick winners and losers - you make it difficult to calculate risk, and thus drive speculation in untested and unknowable markets. Few investors with substantial funds won't be worrying over the questions raised by 5 months of this administration's (including Congress!) financial activities. This started last year with the nationalization of Fannie and Freddie in order to stuff them with bad debt from the banks and investment houses, but this year's deeds (including legislative clauses to abrogate protections in bond servicing agreements) have added a new level of risk to all such obligations.
Update: Regarding the threat to investors, CA serves once again as the leading edge of the next trend. See Rob Dawg's post on the recent moves in the CA legislature regarding municipal bankruptcies and unions.
![]()
