 MaxedOutMama
Friday, September 30, 2011
And Now The TGIF Good News
The case for a slower, more restrained US downturn lies in two reports today, not to mention the hope for next year in housing. Chicago PMI (concentrates on heartland production) is PDG, and so is NACM.
Neither of these reports show anything that can prevent the US from entering a downturn - far too much of our economy is based on consumer spending at levels disassociated with increases in real incomes and government spending at levels disassociated with the levels of taxation that the real economy can bear without buckling. In short, our only long-term hope is to restructure.
Nonetheless, the relative strength in these two reports does suggest that there are some underlying positives that could limit the scope of a downturn and also tend to suggest that there is enough base-level strength in low financial costs and a slow reindustrialization to support a non-catastrophic restructuring.
We should not do the jobs thingie - we should look at the relative strengths we have and try to accentuate them. We probably should raise FICA withholding back to its normal level in 2012, restore and increase the MWP to $500 with all other terms left. This would represent a large tax increase on the higher income households, but they can stand it and the relative strength it would insert into the economy from the lower levels would greatly help.
The Euro crash will not last forever - trying to pretend unpayable sovereign debt will be paid is a parasite that will either kill its host or be killed. The situation cannot drag on for more than the middle of 2013, and as soon as it is resolved the US will come under fire.
We need to make sure we are strong enough at that time to reassure investors. I think we can pull it off if we just use some common sense. Common sense in an election year in the US is hard to come by, but perhaps we've suffered enough to fall back to something that will work.
So to our feckless president I would say "If you can't lead then follow, and if you can't follow then get out of the way."
2012 will be a tough year for the global economy, but price adjustments will happen and at the end of the year the situation will look different. It's up to us whether we are willing to put aside the fantasy phase of US politics and buckle down to achievable real-world progress.
With A Whimper?
Let's see: I stayed up late to catch the Markit PMIs for China and Japan. They weren't good. Chinese manufacturing is still in contraction with input price increases accelerating(!!!!) and Japanese manufacturing fell to 49.3 from 51.9 in August. The report notes weakness in Chinese orders as one of the causes of the fall in Japanese new orders. Japanese retail sales in August fell hard. Falling retail sales plus falling manufacturing presents a pretty difficult growth picture! So I then grumped my way off to bed.
This morning, I got a big fat stinking three-day-dead mackerel in the face in the form of Personal Income and Outlays for the US, which executed a real -0.3 negative for income on the month and a real 0.0 for Personal Consumption Expenditures (PCE) on the month. I thought from Treasury Receipts that nominal incomes (reported a 0.0) should be higher for August, although the high inflation is still cutting into real incomes. I will go back and look at receipts as soon as I have time. Maybe I missed something, but my first impulse is to say that this will be revised up (although still not to a real increase).
The preliminary benchmark revision for the establishment survey is out. This is still not real-time - it is picking up pulses from when the economy was stronger and employment was picking up in March - but it is certainly closer to current figures. This revision is deployed in February of 2012. See the release for more details.
Let's see - we have some other goodies here in the economic report grab bag. Eurozone inflation was reported to have jumped from 2.5% in August to 3.0% in September. This seems likely to delay any ECB move to cut rates, but most people think that the ECB will cut rates before the end of the year. It depends partly on inflation IMO. German retail sales were reported down 2.9% on the month. German unemployment keeps falling - it is currently below 7%!!!!! That's got to be the lowest since reunification. But Germans are experiencing increasing inflation, so it is reasonable perhaps that they are spending less in real terms. Unlike US retail sales, Germany reports inflation-adjusted retail sales.
The Euro is dropping and this may add to inflation. Normally you fight that with rate increases, not decreases. I think if I were the ECB I'd raise rates, because lower rates overall won't get through to the debt-troubled countries, and if the Euro drops more German unemployment will keep dropping, but everybody may just keep spending less. With a weakening market for exports, eventually that will tail off anyway. If you raise rates and cut inflation, there may be more spending oomph overall in the Eurozone. Just a thought. At this point a lower Euro is helping economies like Germany's, but it will over time still feed consumer inflation.
I think Germany's current fall in retail is cyclical and highly related to heating oil purchases for winter. So I expect this to improve later in the year. Or do I just hope for change? Well, anyway I expect the first shock to wear off and more Germans to hit the stores by November.
New Zealand got downgraded. This will not shake world markets. However the blinding fall in coffee on commodity markets shows what kind of downdraft we can expect in pricing. Part of the reason for the fall were reports that warehousing for green beans was quite well stocked indeed, and harvests were looking pretty good. But the truth is that earlier in the year no one cared about these stats, and now they do, which shows a change in trading methodology. These sorts of shifts generally last for at least six months, so risks are on the downside for all such commodities.
I also believe that while prices will adjust, they will not adjust quickly. There is too much money out there looking for a home, and with the equity markets doing poorly, especially in Asia, there is no other home. Therefore we are still not in a trading economy at which prices are adjusting on trade flows and supply, but rather still in a financial economy at which prices are adjusting for changes in money flows and supply. Given the choice of accepting a negative real rate of return on bonds and being chained to the fate of one currency, accepting a possible negative real rate of return with the option of being able to shift currencies smoothly still makes commodities look somewhat appealing even with high downside risks. Personally I would not do this, but I think producers will continue to stockpile supplies and so there is some near-term support for use commodities.
Such trading schemes generally produce nasty, sudden disruptive adjustments that hurt real trading of goods, so I expect the current sorrowful trend to continue. I also think that trading in such commodities has a much higher downside risk than the market believes. Oil now has no real support at almost any price level; I don't THINK it will go much below $45, but it could. It could go below $20 in a year, and that's more than a 5% probability. It all depends on how fast the global economy can adjust. I do think we have some slow adjustments in order for a while, because oil has a high psychic comfort level at this point. Note that abruptly the high copper stockpiles have emerged as a pricing factor; this is an example of the same evolution.
I do not think the Chinese manufacturing figures are quite as bad as they seem. As far as I can tell, Chinese manufacturing output is being dragged down by the inability to finance large buys of input costs. So manufacturers have shifted toward caution and lower output levels in order to try to retain the ability to finance new production runs on received orders. This does imply that there is further trouble ahead. I have to believe that part of the problem is construction and development companies that are borrowing money in the 15-25% range. This surely must shut out a lot of self-financed industrial investment!
Thursday, September 29, 2011
I Think I'll Bother
Of late I have gotten really apathetic and depressed about pointing out the nonsense in many news reports, but this one was kind of over the top:

The important column is the "Current" Column. Very few of the mortgages exit via pay-off, although probably a lot are written down on short-sale or DIL - (most of rightmost column).
Now needless to say, as time rolls on more and more modified mortgages will default. For 2008, less than 29% of these mortgages are current or paid off. For mortgages modified in the first quarter of 2011, ONLY 77.7% are CURRENT. This is still an appallingly bad performance after at most five modified scheduled mortgage payments.
Beginning on page 5 you can see a breakdown of performance by 60 day delinquency rates at 3, 6, 9 and 12 months by year of modification, beginning with 2008 and ending with Q1 2011. The quality has improved overall, but still is pretty bad considering how much the payments have been dropped (see page 36 for 30 days plus after a year), but now delinquency rates on the overall mortgage portfolio have started rising again.
I really hate this report, because it seems to me that there are elements of dishonesty and, well, spin in the way the data is presented. I guess I'll write more on this tomorrow - I've shut up all these months, but I'm really irked now.
One in five homeowners whose mortgages were modified under a program aimed at reducing foreclosures defaulted again within a year after their payments were cut, the U.S. Comptroller of the Currency reported today.The report is OCC's Mortgage Metrics for Q2. A picture is worth a thousand words, so this chart from page 45 should be worth at least 500:

The important column is the "Current" Column. Very few of the mortgages exit via pay-off, although probably a lot are written down on short-sale or DIL - (most of rightmost column).
Now needless to say, as time rolls on more and more modified mortgages will default. For 2008, less than 29% of these mortgages are current or paid off. For mortgages modified in the first quarter of 2011, ONLY 77.7% are CURRENT. This is still an appallingly bad performance after at most five modified scheduled mortgage payments.
Beginning on page 5 you can see a breakdown of performance by 60 day delinquency rates at 3, 6, 9 and 12 months by year of modification, beginning with 2008 and ending with Q1 2011. The quality has improved overall, but still is pretty bad considering how much the payments have been dropped (see page 36 for 30 days plus after a year), but now delinquency rates on the overall mortgage portfolio have started rising again.
I really hate this report, because it seems to me that there are elements of dishonesty and, well, spin in the way the data is presented. I guess I'll write more on this tomorrow - I've shut up all these months, but I'm really irked now.
At This Point We're Just Looking To Slow The Bleeding
Markit Retail PMIs. Italy's still in deep, France is doing better, Germany's not really, Europe as a whole is falling more slowly. Because inflation is the problem, a slower pace of fall gives a chance for prices to come down. But Europe seems to be seeing increasing inflation rather than the alternative.
US initial claims are lower this week. Four-week average at 417K, but that isn't very encouraging for employment.
GDP Q2 reported at 1.3%. GDP Q3 ought to be at least 1.7-1.8%. We'll see. The US seems to be entering another few hard months based on the early store/services data I'm getting - but maybe this is just temporary based on BTS spending. A lot of households might be tight this month.
I think the US restructuring will take quite some time. It's focused on the states and localities at this point, but that will surely take another five-six years?
Census publishes estimates of state and local tax revenues. The numbers are not necessarily directly reflective of the economy, because tax increases abound, and on occasion in good times sales taxes and so forth will be cut. In particular, looking at the data through Q2, it's remarkable how much Q2 property tax revenue has risen in a few years. Needless to say it is not because of massive building or value increases; it's because of higher millage rates. In most states, when the value of the property goes down, the locality just increases property tax rates. Home values are reported by Case-Shiller to be back at 2003/2004 levels. In Q2 2004, property tax receipts were 61,509. In Q2 2011, property tax receipts were 88,518. In Q2 2001, property tax receipts were 51,249. Call me Ishmael, but I don't see how this is not creating a further impact for would-be homebuyers in some areas.
I was flipping through Zillow looking at their estimates, and in some of the high-tax areas, you get properties with an estimated total housing payment composed 70% of property taxes. This is reaching the breaking point, surely?
Wednesday, September 28, 2011
An Ugly Landscape When You Look Up
Roubini said yesterday in some panel discussion or another that the US was already in contraction and most other developed economies were heading into one. On that chirpy note, we start our Wednesday with a raft of reports about the Euro problem. The longer they play with this Greek thing, the larger the eventual loss.
The UK is clearly thanking its stars that it never went Euro. German inflation is up again, and this is not going to fill the Bundesbank with optimism and the urge to send Euros elsewhere by assuming more debt. Schäuble's conflict with Geithner is of long standing (that link is from May), and the positions have hardened. Attempting to build a huge Euro bailout fund would in fact denigrate Germany's credit rating, so success appears impossible over a couple of years time frame.
My guess is that the Greek question will break very soon, although apparently they are now opting for a property tax. That may prove suicidal - it looks like everyone who can is bailing out of Greece, so the country is going to be left poor with no investment.
While currently the rate isn't that bad - maximum 16 Euro a square meter - the chance of it being raised is high as the economy gets worse. )One square meter is about 10.76 square feet, so a 1,100 sq ft dwelling would be taxed about 102 Euro, or around $140 USD.] Bad numbers - could be be up to $2,200 or so. If you confiscated all residential property in Greece you could just about clear up Greece's debt - that is, if you could turn the property into money. But you couldn't do that, because once the government starts confiscating property no one will buy property. So Greece is on its last legs. Whatever it can get from measures such as this might be sustainable (and certainly collectible), but ultimately it needs a big debt writedown to start rebuilding its economy.
US durable orders for August looked good. There was a slight drop in new orders, but when you look at things a bit more deeply, most of the summer pop was in response to the clearing of the Japanese supply line block. Still, capital goods and machinery show that the US manufacturing recovery is still creeping along. At this pace, it is not enough to overcome the immense consumer drag, and it is still dependent on external sales for support. Any minor change in housing investment on the positive side will add a big relative boost.
Most of the basic economic flux (aside from the issue of government policy) derives from uncertainty about the pace of auto sales in the next year.
So I am marginally more comfortable with US prospects. I think we are in a recession, but it is a restructuring recession and not a cartwheeling-into-the-abyss recession. Unfortunately commodity prices will have a huge effect on the US economic trajectory over the next year. We have to get to the point at which real incomes for the bulk of working people aren't declining.
Note: Petroleum:
On a YTD YoY basis, petroleum products supplied are -0.7%, gas is -1.1%, and total imports are -10.2%, compared to a 4-week MA of -1.8% for products supplied, gas at -2.4%, and total imports at -12.3%. Current crude inventories are just above the average range for this time of year, so supply is good. Gas supplies are above the upper limit of the average range, and diesel supplies are near the upper limit of the average range. The average range is a five-year construct, so that is good strong supply, considering that total petroleum products supplied have been down consistently for years:
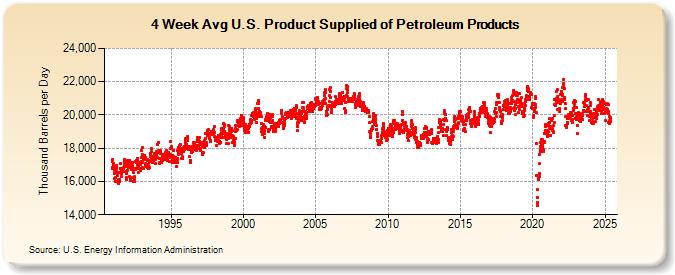
Nonetheless I think you will see petroleum prices only walk down, because there is just too much money out there chasing too few investment vehicles. I find it impossible to look at this graph and claim that we are not in recession. Unfortunately it is not just us, so I really wonder what Q1 of 2012 will look like globally. The global economic environment isn't going to get any better for a while.
The UK is clearly thanking its stars that it never went Euro. German inflation is up again, and this is not going to fill the Bundesbank with optimism and the urge to send Euros elsewhere by assuming more debt. Schäuble's conflict with Geithner is of long standing (that link is from May), and the positions have hardened. Attempting to build a huge Euro bailout fund would in fact denigrate Germany's credit rating, so success appears impossible over a couple of years time frame.
My guess is that the Greek question will break very soon, although apparently they are now opting for a property tax. That may prove suicidal - it looks like everyone who can is bailing out of Greece, so the country is going to be left poor with no investment.
While currently the rate isn't that bad - maximum 16 Euro a square meter - the chance of it being raised is high as the economy gets worse. )One square meter is about 10.76 square feet, so a 1,100 sq ft dwelling would be taxed about 102 Euro, or around $140 USD.] Bad numbers - could be be up to $2,200 or so. If you confiscated all residential property in Greece you could just about clear up Greece's debt - that is, if you could turn the property into money. But you couldn't do that, because once the government starts confiscating property no one will buy property. So Greece is on its last legs. Whatever it can get from measures such as this might be sustainable (and certainly collectible), but ultimately it needs a big debt writedown to start rebuilding its economy.
US durable orders for August looked good. There was a slight drop in new orders, but when you look at things a bit more deeply, most of the summer pop was in response to the clearing of the Japanese supply line block. Still, capital goods and machinery show that the US manufacturing recovery is still creeping along. At this pace, it is not enough to overcome the immense consumer drag, and it is still dependent on external sales for support. Any minor change in housing investment on the positive side will add a big relative boost.
Most of the basic economic flux (aside from the issue of government policy) derives from uncertainty about the pace of auto sales in the next year.
So I am marginally more comfortable with US prospects. I think we are in a recession, but it is a restructuring recession and not a cartwheeling-into-the-abyss recession. Unfortunately commodity prices will have a huge effect on the US economic trajectory over the next year. We have to get to the point at which real incomes for the bulk of working people aren't declining.
Note: Petroleum:
On a YTD YoY basis, petroleum products supplied are -0.7%, gas is -1.1%, and total imports are -10.2%, compared to a 4-week MA of -1.8% for products supplied, gas at -2.4%, and total imports at -12.3%. Current crude inventories are just above the average range for this time of year, so supply is good. Gas supplies are above the upper limit of the average range, and diesel supplies are near the upper limit of the average range. The average range is a five-year construct, so that is good strong supply, considering that total petroleum products supplied have been down consistently for years:
Nonetheless I think you will see petroleum prices only walk down, because there is just too much money out there chasing too few investment vehicles. I find it impossible to look at this graph and claim that we are not in recession. Unfortunately it is not just us, so I really wonder what Q1 of 2012 will look like globally. The global economic environment isn't going to get any better for a while.
Monday, September 26, 2011
Lalalalalalaaaaa
What can one do but party hearty? The Chief keeps walking around making comments about "putting on your marching shoes" and advises me to "stop complaining". I'm glad he's getting a charge out of this, because I am less than amused.
There's an article up on Drudge about the AMA, ObamaCare and actual doctors. SuperDoc quit the AMA in disgust years ago. The article is fine as far as it goes, but it doesn't go far enough.
In 2012, Medicare physician reimbursements are scheduled to drop 29.5%. The final rule is due November 1st, but the proposed rule gives a good feel for what this is going to cost doctors. That's 176 pages and hard going, so try this short article to get a feel for things. Excerpt chart:

Needless to say this sort of thing provokes either limitations on patients seen or cost-shifting to other patients.
Paying $16.53 for an X-ray is a bit ridiculous, don't you think?
SuperDoc is going to make about $48 per office visit on Medicare patients in 2012. This is not enough to keep the lights on (older patients are far more complex to deal with, require more time spent with them, and require far more follow-up), and he may have to limit Medicare patients, because if you don't keep your non-gov/gov ratios up, you're dead. This causes him great agony, because he is already 70 (working six days a week) and he keeps wandering around woefully wondering who is going to care for these people, and then, evincing considerable angst and threatening to leave the country. He claims Australia is the best bet, but his wife is holding out for Canada.
But this is the first of many projected Medicare cuts under ObamaCare. Five years from now things are going to get much worse.
I don't think the average person realizes how the medical industry works. Aside from the fact that SuperDoc does a tremendous amount of research on each patient with complex conditions (and many of the elderly have complex conditions), the administrative staff often does hours of work behind the scenes to get the required testing and medications through.
SuperDoc maintains a list of doctors he likes and thinks highly of, and over the last few years I called some of them to find out what they were doing. Almost all of them are cutting the vast majority of Medicare patients out of their practices, because they just can't practice quality medicine any more. The bitch of it is that many of the elderly respond superbly to good medical care (ultimately SuperDoc's way of practicing medicine is cheap), so that by shunting these people into practices that provide a much lower standard of care, we are probably costing the system a lot more.
Another problem is that as our arsenal of weapons against various conditions grows, the interactions between the weapons and the living being grow ever more complex. Without carefully balancing out risk factors, the risk of doing real damage to the patient grows. SuperDoc and I have been working on a project to apply some of the P-Nat risk-mapping techniques in the medical field, and so far it is promising. But I am also finding it terrifying, because he'll hand me a medication or condition to analyze, and I keep coming up with these risk holes (if you don't pay attention to them you run a very high risk of harming the patient), and then I take this stuff and the data back to SuperDoc and he gets very excited and tells me it is right.
If SuperDoc is correct, then medicine has reached a point at which it must learn to manage complexity in a different way and at an individual level. There seems no hope of doing that with the direction our current system is taking. The other "good" doctors I have spoken to all reiterated one of SuperDoc's worries - that they were seeing a high incidence of what they regarded as malpractice by specialists, due to a failure to take into account all the patient's conditions.
It seems pretty obvious that assessing general risk is going to be important in delivering workable medical care, and I don't see how we can do it on our current path. You can't defund primary care and basic diagnostics without fubaring the whole darned thing. Also we have to be realistic about the costs of medical care for the non-governmentally covered patients - these costs are going to show up in medical care costs for 40 year-olds, and that is neither fair nor sustainable.
Hah, Numbers, Meaning, Punt
It kind of bugs me that the press keeps reporting numbers without statistical significance as if they mean anything.
New Home sales:
The August monthly change and the YoY change are so far below statistical significance that it is not worthwhile thinking about the numbers. The monthly is negative and the YoY is a larger 6.1% positive, but the 90% confidence range on the YoY is 18.8%, so just ignore it and throw it in the "nothing happening here" bucket.
The only number on this report that has statistical significance is the YTD YoY comparison, which is unfortunately negative at -8.3%, but this is influenced by housing credits, so again, ignoring it is the wisest course. The 90% confidence interval on that is +/- 4.4%. However revisions over the summer have been up, and this can be viewed as a moderately positive sign. When series like this drop out of statistical significance, I place more weight on revisions patterns than the numbers themselves.
Both median and average sales prices were down in August, but I think this is a mix effect. Not that I don't believe home prices are still dropping, but the new homes being built are mostly smaller and more modestly constructed, and as the older ones move off the market it is inevitable that offerings will shift downward in price.
CFNAI-MA3 for August came in at -0.28, which leaves June, July and August all below the -0.25 line. Monthly for August was -0.43. In March/April we took the big hit - the March monthly was +0.43 and then April was -0.84. Since then we seem to have marked out a new negative plateau, but unfortunately it is probably not permanent. At these levels, CFNAI-MA3 is consistent with either slow economic growth or the beginnings of recession.
The bummer about this is that it occurred during the period when we had something of production rebound due to clearing of the Japanese supply line blockages. So from here on we get more of "pace" effect in this stat, and it probably isn't going to look that good. I'm not looking forward to this index next February.
On Thursday we get the GDP revision (maybe up a notch or two) and on Friday we get Chicago PMI. There's housing chaff in the interim, none of which really is going to make a difference. Wednesday we have durable goods orders, and I do want to see that one.
If you are wondering about the equivocal nature of CFNAI, look at this graph:

IMO, it's got "double dip" written all over it.
The MI Consumer Confidence is not an emotional reading - according to the retail reports, it's because people are spending more for necessities and constraining spending on stuff like pharmaceuticals, not to mention eating out, electronics, etc.
I just got back from the cardiac hospital, where the Chief got the coveted "Most likely to live if continues good behavior" award, and I have to head out again. So see you later.
PS: Of all the potential presidential candidates, I like Herman Cain the best. Take a look at his 9-9-9 plan. I have some issues with it, but this type of thinking is necessary if we are to have a chance of escaping pure economic ugliness. We are forced to restructure or stay in our death spiral. History says that restructuring can work, but we have to start moving on it quickly. I wish Obama were more economically literate, but by now it is clear that he isn't and has no intention of studying.
Saturday, September 24, 2011
CBO Testimony About Budget Options
Worth a read!
Thus, according to CBO’s projections under current law, even with the new constraints on discretionary spending, federal spending excluding net interest will grow to 19.9 percent of GDP in 2021—compared with the 40-year average of 18.6 percent. And the composition of that spending will be noticeably different from what the nation has experienced in recent decades: Spending for Social Security and the major health care programs will be much higher, and spending for all other federal programs and activities, except for net interest payments, will be much lower. Alternatively, if the laws governing Social Security and the major health care programs were unchanged, and all other programs were operated in line with their average relationship to the size of the economy during the past 40 years, total federal spending excluding net interest would be much higher in 2021—nearly 24 percent of GDP. That amount exceeds the 40-year average for revenues as a share of GDP by nearly 6 percentage points—even before interest payments on the debt have been included.SuperDoc has me doing research on various aspects of breast cancer, which is making me twitch. Thus, I find reading such as the above less troublesome in contrast. This may not be true for all, so if you are having a good weekend you might want to postpone that link until Monday!
Friday, September 23, 2011
CA Unemployment Is At 12.1% - What Does It Mean?
And August CA state sales and use taxes were substantially below 2010's (7%), as were the July/August figures. It's hard to raise revenue in this environment.
For comparison, look at GA. Its economy is hurting, yet sales tax collections are still eking out a rise. One thing I always look at is the alcohol tax receipts - they tend to flag turns in state economies. Both are dropping YoY.
I have the sense that we are committing an eerie reprise of 2008, with a somewhat lesser amplitude but following a very similar curve. Last time we were crashing in from inflation-cut real incomes and the effects of cutting off the circulation of money gained from unsustainable private debt increases. This time we are folding up from inflation-cut real incomes and the effects of cutting off the circulation of money gained from unsustainable public debt increases. The more things change....
This year the 2007/2008 cycle is collapsed into one year.
There's a lot of talk about losses in government jobs, but look at the longer time sequence:

This is total private. As you can see, the number of private jobs is below where it was 10 years ago, not to mention 2007.
And here we have government jobs.

Relative to private jobs, government jobs are still far above the number a decade ago, and just about where they were in 2007.
Clearly the government sector cannot keep growing at the expense of the private sector - something is going to give. And it will give soon, because the revenues aren't there and now the really big government expenses for government retirees kick in.
The numbers:
From Table 2.1 we can add in another piece of the load the economy must carry, and that's government social benefits to persons. In Q2 2001 those amounted to 1,134.6 versus total wages and salaries of 4,961.4. In Q2 2011 these amounted to 2,308.6 versus total wages and salaries of 6,658.4. Respective ratios of 22.9% and 34.7%. Thus our fiscal problems.
Inflation does not help the fundamental imbalance there, and it's the big one. Also not included are all the unfunded expenditures, mostly in state and local, for government retirees. Very few of the systems accrued for retirement medical benefits, for example, and those must be paid out of current revenue each year.
People say we won't default on our debt, but I think we will. Inflation doesn't help the fundamental imbalance unless we cut benefits by not adjusting for inflation. People believe that we can inflate our way out of this, but we can't.
In that regard, we should remind ourselves that of all the government social benefits paid in 2011 Q2, Medicaid and Medicare amounted to significantly more (991.5) than the total of SS benefits (712.2). Note that these amounts are annualized on a seasonally adjusted basis. Clearly we would cut SS to nothing quite rapidly if we tried to compensate for medical increases by deflating SS payments. Also, Medicaid and Medicare benefits will become somewhat useless if reimbursements keep dropping - eventually, if the government doesn't pay for the service it will not be available. Further, let us not forget the greatly expanded Medicaid benefit and the new subsidy for private insurance that go into effect in 2014 under current law. These will make the picture far, far worse by 2017.
So we are going to default. How deeply we default depends on how quickly we can expand the private sector. And, to be realistic about it, a lot of that default may be inflicted on retirees, but most of it will hit the wealthier/comfortable retirees. Jimmy J. got uncomfortably close when he commented on a retirement income of 36K. By 2025 that may be about right.
For comparison, look at GA. Its economy is hurting, yet sales tax collections are still eking out a rise. One thing I always look at is the alcohol tax receipts - they tend to flag turns in state economies. Both are dropping YoY.
I have the sense that we are committing an eerie reprise of 2008, with a somewhat lesser amplitude but following a very similar curve. Last time we were crashing in from inflation-cut real incomes and the effects of cutting off the circulation of money gained from unsustainable private debt increases. This time we are folding up from inflation-cut real incomes and the effects of cutting off the circulation of money gained from unsustainable public debt increases. The more things change....
This year the 2007/2008 cycle is collapsed into one year.
There's a lot of talk about losses in government jobs, but look at the longer time sequence:

This is total private. As you can see, the number of private jobs is below where it was 10 years ago, not to mention 2007.
And here we have government jobs.

Relative to private jobs, government jobs are still far above the number a decade ago, and just about where they were in 2007.
Clearly the government sector cannot keep growing at the expense of the private sector - something is going to give. And it will give soon, because the revenues aren't there and now the really big government expenses for government retirees kick in.
The numbers:
2001 Aug:There's another way to look at this. Table 2.2B contains a breakdown of wage and salary disbursements so that you can get total government versus total private. In 2001 Q2, government wages and salaries were 815.4 vs private sector's 4,146.0, for a gov/private ratio of 19.7%. In 2011 Q2, it was 1,192.2 versus 5,466.2, for a gov/private ratio of 21.8%. These numbers do not accurately reflect relative costs; payments for benefits (retirement, insurance, etc) are recorded separately, and there government employees receive far more relatively.
Total private (nonfarm): 110,544,000
Total government: 21,218,000
Ratio gov/private: 19.2%
2011 Aug:
Total private (nonfarm): 109,170,000
Total government: 21,962,000
Ratio gov/private: 20.1%
From Table 2.1 we can add in another piece of the load the economy must carry, and that's government social benefits to persons. In Q2 2001 those amounted to 1,134.6 versus total wages and salaries of 4,961.4. In Q2 2011 these amounted to 2,308.6 versus total wages and salaries of 6,658.4. Respective ratios of 22.9% and 34.7%. Thus our fiscal problems.
Inflation does not help the fundamental imbalance there, and it's the big one. Also not included are all the unfunded expenditures, mostly in state and local, for government retirees. Very few of the systems accrued for retirement medical benefits, for example, and those must be paid out of current revenue each year.
People say we won't default on our debt, but I think we will. Inflation doesn't help the fundamental imbalance unless we cut benefits by not adjusting for inflation. People believe that we can inflate our way out of this, but we can't.
In that regard, we should remind ourselves that of all the government social benefits paid in 2011 Q2, Medicaid and Medicare amounted to significantly more (991.5) than the total of SS benefits (712.2). Note that these amounts are annualized on a seasonally adjusted basis. Clearly we would cut SS to nothing quite rapidly if we tried to compensate for medical increases by deflating SS payments. Also, Medicaid and Medicare benefits will become somewhat useless if reimbursements keep dropping - eventually, if the government doesn't pay for the service it will not be available. Further, let us not forget the greatly expanded Medicaid benefit and the new subsidy for private insurance that go into effect in 2014 under current law. These will make the picture far, far worse by 2017.
So we are going to default. How deeply we default depends on how quickly we can expand the private sector. And, to be realistic about it, a lot of that default may be inflicted on retirees, but most of it will hit the wealthier/comfortable retirees. Jimmy J. got uncomfortably close when he commented on a retirement income of 36K. By 2025 that may be about right.
Thursday, September 22, 2011
Twisted!!!

Because nothing says "I love you" like Japanese-style long rates.
Look at that 30-year, (she wrote reverently).
You can get the Treasury charting function here, but let me advise you not to try the longer terms at home. It was a true labor of love to get this. While I was waiting for the data to load, stars collided, galaxies were born, my dog nearly died of boredom and my patience almost ran out.
According to Treasury, the 30 year closed at 2.78% and the 10 year at 1.72%. The 7 year is at 1.24%. CPI-U is at 3.8%.
It will be interesting to see what happens. This is mostly produced by the combo of the bad economic news, especially the travails of Europe, reinforced by the Fed's announcement of Operation Twist. One can't feel confident about the economic trajectory we are seeing, and it is hard to imagine Italy's situation improving so the Euro angst is doomed to continue until it breaks into reality. That will happen within a year or two, and then Lord only knows what happens to Treasury rates.
You have to think there will be a wave of refinancings, although the net return for many will be low. For older people currently in good financial shape but with mortgages, the opportunity to refi into a 15 year at incredibly low rates might be enticing. With equity and good credit, 15 year rates should drop below 3%.
From my POV, this is a deflationary move. The rewards for saving money (or begging your parents for an equity handout) to qualify for loans at low rates are brilliant, but with rates so low underwriting criteria are surely going to tighten further. As rates fall,
rate risk increases and the relative percentage of loss risk rises, so underwriting criteria tend to tighten. It's hardly an easy money environment.
If that seems obtuse, let's consider FHA mortgage insurance premiums. Currently, the upfront premium is 1%. The annual premium varies according to downpayment and loan term.
Term > 15 years:BUT there's a kicker - if you have a 15 year term or less, and your Loan to Value ratio is under 90%, you don't have to pay any annual premium - just the one-time upfront 100 basis pts.
DP = or > 5%: 1.1% (110 basis pts)
DP < 5%: 1.15% (115 basis pts)
Term 15 years or less:
DP = or > 10%: 0.25% (25 basis pts)
DP < 10%: 0.50% (50 basis pts)
This raises interesting economic scenarios. For example, good mechanics are in short supply right now. A lot of skilled tradesmen could end up in far more decent economic shape in 10 years than the person who racked up a lot of debt for an expensive secondary education, even if that education paid off. Racking up a 40K-80K joint debt for a young couple has a lot of implications, whereas a young couple that is more stereotypically "working class" could save money, live at home for a few years, get married and buy a starter house with a good DP and a very low 15 year mortgage in many areas by the time they were in their mid 20s.
This is the reason I think we are going to emerge from this with an economy that looks much more like that of the 50s and than any time later.
Initial Claims, Unexpectedly
See, these babies unexpectedly rise or fall, depending on how you look at it, but there are too many of them no matter which way you look at it. Last week's figure was initially reported at 428K, which was revised up to 432K. This week's initial figure is 423K. The four-week moving average is now at 421K, up from last week's first-reported figure of 419,500.
Among the bummers here is that it is hard to get much of a drop of unemployment with claims in this range and indeed they are more consistent with increasing levels of unemployment. The 4 week MA for the comparable week in 2010 was only 37K more than this year's.
The 4-week MA for continuing claims was initially reported last week at 3,741,000. This week it is at 3,742,000, but through the magic of upward revisions that is reported as a slight decline. August 27 continuing claims were at 3,729,000. Although the damage is slight, the trend is bad and basically unaffordable with large companies tending to announce layoffs and declines in real average wages.
BLS reports 26 states plus DC having jobless rate increases in August, 12 having drops, and 12 with no change.
The FOMC announcement of Operation Twist (only) seems to have produced substantial selling fervor, most notably in oil. Further bank downgrades haven't helped Mr. Market develop the itch and the twitch in the buying finger. Gold prices are in sync downwards, completing the panic pattern. But the bad news is widespread at this point, with Europe in trouble, China sliding quietly down, India compromised, and many peripheral Asian economies seeing signs of a downward shift
The Fed could not notably improve matters by announcing QE3. It would drive asset prices up, but only temporarily. Mr. Market is quite capable of calibrating prices to spending power and maybe we'd just better let Mr. Market do his work for a while. The reason we are seeing the very strong global coordination is because prices have gotten out of sync with ability to consume (and therefore produce) at these prices. A price fix before the global downturn gets out of hand is the quickest medicine for this malady.
Note: The extent of the global contraction can best be seen in the PMIs, which have taken a remarkable turn for the worse over the last quarter. Markit's flash releases today only confirm the trend, with the Eurozone sliding into outright contraction, and France and Germany continuing expansions, but with declining trends and returns to levels last seen in the summer of 2009. Clearly, these Atlases will not continue to hold up the starry firmament of Euro prosperity. China does not enthuse either, although projections are for continued growth on growth in internal demand. These rates of internal expansion are causing continued inflation, which, if anything, appears to be still accelerating.
PS: The House voted down the spending authorization again. If you listen to the Dem talking points, this is a move by hidebound conservatives. But in fact, almost no Democrats voted for it and quite a few Republicans didn't, so the real picture is more complicated. However the fiscal year is almost over, and something has to be done by the end of September, so this is not going to soothe roiling markets. The debt limit is not a factor now, but spending authorizations (the US hasn't had a budget since the Dems took Congress in 2006) are a necessity also. US Treasury Debt to the Penny.
Further: Reuters article about the "unexpectedness" of the Eurozone PMI result.
Tuesday, September 20, 2011
Under Construction
I have another busy day ahead. Quick notes:
Parts of the new residential construction report are statistically significant, and parts aren't. Under construction is down from July, but not to a degree that's statistically significant. YoY is down 7.9%, and that is statistically significant. However the authorizations side offers more hope of some rebound off the bottom next year, with August authorizations up 7.8% YoY, which is most definitely statistically significant. So right now, we're not seeing economic boost, but the case for next year is more optimistic. One has to wonder what effect our current economic troubles will have on that, but with the pace of housing activity being so remarkably low viewed against history, it's not hard to argue that there is space for improvement.
Struggling for optimism, this Bloomberg article starts out by suggesting shipping companies could be helped by a last minute surge to restock if consumers all of a sudden start to spend like gangbusters for the holidays. I started snickering on the first paragraph with the comparisons to 2009 and the theory that retailers are just taking this terrible risk by understocking for the mad rush of consumers hellbent on spending their last dollar. Further in, the article gets more realistic:
I don't think retailers are taking a fearful risk. In 2009 we were months out of recession and real incomes were rebounding. Consumers with jobs felt a lot more confident about keeping them by the end of 2009, and having a bit of extra money, they spent it. That's the reason I posted all those graphs! Neither holds true this year:


Tomorrow we get existing home sales. I note in my driving around that there is tremendous inventory out there. If consumers want to buy a home and can qualify, they have plenty of options. It seems to me that the housing crash has diffused and spread to new areas and homes at higher price points. We'll see, but I am not that optimistic.
We also get the FOMC meeting announcement tomorrow, with the big bet being on Operation Twist (Fed shifting Treasury purchases to push long rates down). I don't think that will do much if any good, but I don't think it will do much harm either. Another round of quantative easing would produce another round of Main Street strangulation.
I do have some good news for you - we are not going to die from CO2 levels, the negative feedback effect from clouds is real, rather than the IPCC's assumed positive feedback. Of course, if you are truly a dedicated pessimist you can still work yourself up into a fit over this - you could assume that the sun's lower activity levels continue, that we go into a Maunder-type minimum, that CO2-engendered warming doesn't save us, that northern grain harvests fail and that the world endures another round of starvation-induced global warfare.
I am worried about the sun's lack of activity, but I would argue in mitigation that Maunder-type minimums seem to be somewhat rare, that aridity often goes along with cold spells, and that lower cloud formation might help the CO2 kick back in. Still, at this time it might be wise to stop burning the corn and stockpile it, just in case.
If you would - prayers for Carl of NOFP. He's had some severe health challenges and is facing another; he's in very real pain now. Pray for guidance for the doctors and Carl, and good healing.
Parts of the new residential construction report are statistically significant, and parts aren't. Under construction is down from July, but not to a degree that's statistically significant. YoY is down 7.9%, and that is statistically significant. However the authorizations side offers more hope of some rebound off the bottom next year, with August authorizations up 7.8% YoY, which is most definitely statistically significant. So right now, we're not seeing economic boost, but the case for next year is more optimistic. One has to wonder what effect our current economic troubles will have on that, but with the pace of housing activity being so remarkably low viewed against history, it's not hard to argue that there is space for improvement.
Struggling for optimism, this Bloomberg article starts out by suggesting shipping companies could be helped by a last minute surge to restock if consumers all of a sudden start to spend like gangbusters for the holidays. I started snickering on the first paragraph with the comparisons to 2009 and the theory that retailers are just taking this terrible risk by understocking for the mad rush of consumers hellbent on spending their last dollar. Further in, the article gets more realistic:
Shipping data currently show retailers preparing for a “muted” holiday season, Hartford said. The combined inbound- container volume at the Los Angeles and Long Beach ports fell 9.4 percent in August from a year earlier, following declines of 2.3 percent and 4.6 percent in July and June, according to Bloomberg data. These ports, the two largest in the U.S., account for about 40 percent of total imports, Hartford said.Heh. You read all that about the shipping at Snarky Mark's first.
I don't think retailers are taking a fearful risk. In 2009 we were months out of recession and real incomes were rebounding. Consumers with jobs felt a lot more confident about keeping them by the end of 2009, and having a bit of extra money, they spent it. That's the reason I posted all those graphs! Neither holds true this year:
Tomorrow we get existing home sales. I note in my driving around that there is tremendous inventory out there. If consumers want to buy a home and can qualify, they have plenty of options. It seems to me that the housing crash has diffused and spread to new areas and homes at higher price points. We'll see, but I am not that optimistic.
We also get the FOMC meeting announcement tomorrow, with the big bet being on Operation Twist (Fed shifting Treasury purchases to push long rates down). I don't think that will do much if any good, but I don't think it will do much harm either. Another round of quantative easing would produce another round of Main Street strangulation.
I do have some good news for you - we are not going to die from CO2 levels, the negative feedback effect from clouds is real, rather than the IPCC's assumed positive feedback. Of course, if you are truly a dedicated pessimist you can still work yourself up into a fit over this - you could assume that the sun's lower activity levels continue, that we go into a Maunder-type minimum, that CO2-engendered warming doesn't save us, that northern grain harvests fail and that the world endures another round of starvation-induced global warfare.
I am worried about the sun's lack of activity, but I would argue in mitigation that Maunder-type minimums seem to be somewhat rare, that aridity often goes along with cold spells, and that lower cloud formation might help the CO2 kick back in. Still, at this time it might be wise to stop burning the corn and stockpile it, just in case.
If you would - prayers for Carl of NOFP. He's had some severe health challenges and is facing another; he's in very real pain now. Pray for guidance for the doctors and Carl, and good healing.
Monday, September 19, 2011
Yikes - S&P, Italy,
Moody's was supposed to make a decision this fall, but S&P jumped in first. I understand their POV:
S&P said it lowered its outlook for Italy’s growth to a 0.7 percent annual average for 2011 to 2014, from a prior projection of 1.3 percent. “We believe the reduced pace of Italy’s economic activity to date will make the government’s revised fiscal targets difficult to achieve,” it saidThe reaction will be interesting. Outlook negative. I guess the Fed and ECB will huddle and throw some more dollars into the ring tomorrow. I wonder if this will come up in FOMC? You would think so.
BIS Quarterly Review Is Out
I always read these things, but right now they are particularly essential. Sept 19th issue. Even if you read nothing else, don't miss the brief recap of the events (only 13 pages). In particular, rates on junk corporate bonds escalated painfully. The syndicated loan feature is excellent from a risk standpoint also.
The article on trade sensitivity to real exchange rate changes provides something to discuss from a US standpoint. Low sensitivity to rate exchanges means that the real economy in a low IIT nation will experience high rates of economic drag (lower growth) when costs of imports rise. Applying this analysis to the tariff question and the wild inflation theory (just print money) shows up the limitations of US options:
There's a table with different assessments of the two measures by countries, and it explains why Greece is staggering along without already going to its own currency. The rewards for Greece of being able to print money in the short term are not great.
The article on trade sensitivity to real exchange rate changes provides something to discuss from a US standpoint. Low sensitivity to rate exchanges means that the real economy in a low IIT nation will experience high rates of economic drag (lower growth) when costs of imports rise. Applying this analysis to the tariff question and the wild inflation theory (just print money) shows up the limitations of US options:
Based on this intuition, the sensitivity of the trade balance to movements in real exchange rates should be much lower in a country with a low level of intra-industry trade (low IIT) than in a country with high IIT. Its imports are unlikely to fall significantly following a real exchange rate depreciation because no domestic industry can easily replace the imports that have become more expensive. Low IIT countries are typically those where raw materials or natural resources like oil account for a major share of imports. They could also be countries that have specialised in particular industries in order to benefit from a comparative advantage in some sectors. By contrast, imports fall much more in a high IIT country that depreciates its real exchange rate, as the country can more easily provide domestic substitutes for imports that have become more expensive. The sensitivity of the trade balance to the real exchange rate should therefore depend positively on IIT.The article also considers import content of exports (ICE). If exports have a high import content, it is not reasonable to assume that depreciating your currency will redress your trade deficit much. So IIT measures the degree of overlap between import and export products (0 IIT if a country imports just products A & B and exports just products C & D; 1 if a country imports products A, B, C & D and exports the same products), and ICE measures dependency of exports on imports.
There's a table with different assessments of the two measures by countries, and it explains why Greece is staggering along without already going to its own currency. The rewards for Greece of being able to print money in the short term are not great.
Sunday, September 18, 2011
My Answer Is No
I had to think it over for a few days before I reached the conclusion. Foxmark's comment on the previous post (containing the 3K question) sums up my thinking process:
The data here can be found at BLS CPS. This is another way of looking at the base of information in the graph in my prior post. First up, full-time median inflation adjusted wages (this excludes self-employed incorporated workers):
This bounces around a lot, and one of the reasons is inflation. Note that real median wages started to rise quite quickly at the end of 2008, coincident with the financial panic.
There is a time lag for higher real wages to feed through the economy, even when you have a rather dramatic move such as this. So the recession ended June 2009. Employment losses lag, of course.
In eleven years, we have made no progress on median real wages. Q2 2011 was $334 - Q2 2000 was $332.
The reason I knew that the Fed's QE2 program would be a disaster for the economy was that it was doomed to further drop real median and below wages, which had been declining slowly anyway. Of course the Fed error was exacerbated to some extent by the truly nutty "deal" reached by the Congress and President at the end of 2010, which raised federal taxes on the bottom 40% of wage earners. There is significant overlap between that bottom 40 percent and older households largely dependent on SS, but still that took the nominal damage to 45% of all households, and the inevitable inflation in base costs involved in the Fed's action took it right to 60%. From there it diffused upward.
And then we must not forgot the job losses. This graph is of fulltime workers:

So not only do we have declining median full-time wages, but we have a substantial employment problem. Rising costs, part-time work or no work. This graph gives me a headache and stomach cramps. I have a Zomig sitting right in front of me, and I may need it to get through this post.
In Q2 of 2000, we had 101,424,000 full time workers. In Q2 of 2011, we had 100,593,000 full time workers. Call me a pessimist, but given the growth in the population, I'd say we are missing a minimum of 6,000,000 full time jobs.
Filling in with part-time jobs obviously does something to household incomes. We have sustained an increase in part-time jobs, but in many circumstances this is a function of employers having leverage and using it to get the cheapest possible employees:

It's stunning to see how the end of the recession boosted part-time jobs, but not full-time jobs.
And it's not just teen-agers and young people. You can't really comprehend the damage we have sustained without looking at what I call the "core" rate of employment, which is workers 25 and over:

This graph is of the number of workers aged 25 and over who are employed full-time.
Remember, when BLS calculates real median weekly wages, it excludes part-time workers!
Shattering. You don't really need to go much further to comprehend why the housing market is so dead. The first-time purchase bracket was already exhausted from easy term lending, and since it has been eroded by the job market.
Even taking into account aging and retirements does not really redress the situation. For one thing, workers cannot retire as early as they used to:

The number of full-time workers over 65 has almost doubled in ten years.
Admittedly that age bracket has expanded, but still.... Mortgages. It's pure hell being 64 and having a mortgage with ten more years of payments.
US Population Pyramids 2001-2011-2025: Detailed breakdown 2011; 2001.

In 2001 there were about 18.3 million 65-74; in 2011 there are about 22.1 million aged 65-74 and about 13 million aged 75-84. The balance of the older population is almost 5.9 million - about 41 million total.
In 1999 there were about 18.3 million in the 65-74 bracket and about 12. million in the 75-84 bracket. The rest of the older population amounted to just over 4 million - about 34.3 million total.


In 2025 there are projected to be about 36.2 million in the 65-74 age bracket. 2030 about 38.4 million, but in the 75-84 bracket there are projected to be 24.4 million versus 2011's 13 million. For 2030, there will be over 8 million in the older age brackets, for a total of over 70 million.
I give up. I wanted to write a post about how huge hunks of our economic problem are structural, not temporary. I'll have to continue this in a separate post.
One-time or limited-duration policies have one-time or limited-duration benefits. The Policy Ineffectiveness Proposition at least assumes that economic agents are forward-looking. The orthodox framework assumes that most consumption choices are impulsive.The specifics of why I don't think the temporary improvement would last:
Limited-duration policies may result in persistent losses, as it is easier to destroy a web of beneficial relationships than to build one.
The data here can be found at BLS CPS. This is another way of looking at the base of information in the graph in my prior post. First up, full-time median inflation adjusted wages (this excludes self-employed incorporated workers):

This bounces around a lot, and one of the reasons is inflation. Note that real median wages started to rise quite quickly at the end of 2008, coincident with the financial panic.
There is a time lag for higher real wages to feed through the economy, even when you have a rather dramatic move such as this. So the recession ended June 2009. Employment losses lag, of course.
In eleven years, we have made no progress on median real wages. Q2 2011 was $334 - Q2 2000 was $332.
The reason I knew that the Fed's QE2 program would be a disaster for the economy was that it was doomed to further drop real median and below wages, which had been declining slowly anyway. Of course the Fed error was exacerbated to some extent by the truly nutty "deal" reached by the Congress and President at the end of 2010, which raised federal taxes on the bottom 40% of wage earners. There is significant overlap between that bottom 40 percent and older households largely dependent on SS, but still that took the nominal damage to 45% of all households, and the inevitable inflation in base costs involved in the Fed's action took it right to 60%. From there it diffused upward.
And then we must not forgot the job losses. This graph is of fulltime workers:

So not only do we have declining median full-time wages, but we have a substantial employment problem. Rising costs, part-time work or no work. This graph gives me a headache and stomach cramps. I have a Zomig sitting right in front of me, and I may need it to get through this post.
In Q2 of 2000, we had 101,424,000 full time workers. In Q2 of 2011, we had 100,593,000 full time workers. Call me a pessimist, but given the growth in the population, I'd say we are missing a minimum of 6,000,000 full time jobs.
Filling in with part-time jobs obviously does something to household incomes. We have sustained an increase in part-time jobs, but in many circumstances this is a function of employers having leverage and using it to get the cheapest possible employees:

It's stunning to see how the end of the recession boosted part-time jobs, but not full-time jobs.
And it's not just teen-agers and young people. You can't really comprehend the damage we have sustained without looking at what I call the "core" rate of employment, which is workers 25 and over:

This graph is of the number of workers aged 25 and over who are employed full-time.
Remember, when BLS calculates real median weekly wages, it excludes part-time workers!
Shattering. You don't really need to go much further to comprehend why the housing market is so dead. The first-time purchase bracket was already exhausted from easy term lending, and since it has been eroded by the job market.
Even taking into account aging and retirements does not really redress the situation. For one thing, workers cannot retire as early as they used to:

The number of full-time workers over 65 has almost doubled in ten years.
Admittedly that age bracket has expanded, but still.... Mortgages. It's pure hell being 64 and having a mortgage with ten more years of payments.
US Population Pyramids 2001-2011-2025: Detailed breakdown 2011; 2001.

In 2001 there were about 18.3 million 65-74; in 2011 there are about 22.1 million aged 65-74 and about 13 million aged 75-84. The balance of the older population is almost 5.9 million - about 41 million total.
In 1999 there were about 18.3 million in the 65-74 bracket and about 12. million in the 75-84 bracket. The rest of the older population amounted to just over 4 million - about 34.3 million total.

In 2025 there are projected to be about 36.2 million in the 65-74 age bracket. 2030 about 38.4 million, but in the 75-84 bracket there are projected to be 24.4 million versus 2011's 13 million. For 2030, there will be over 8 million in the older age brackets, for a total of over 70 million.
I give up. I wanted to write a post about how huge hunks of our economic problem are structural, not temporary. I'll have to continue this in a separate post.
Friday, September 16, 2011
About The 3K Plan
The reason I am sure the 3K stimulus plan would work (at least temporarily) is contained in the following graph, which is derived from the Census Median Household Income series found here:

Click on the graph to get a better look at it.
The top line indexed to the LEFT is the actual changes in US Household REAL Median Income levels as reported by Census.
The rest of the lines look at one and two year percent changes, and they are indexed to the RIGHT.
The doubled line is the two-year percent change. I'm trying to make my graphs color-blind sensitive.
If you look at this graph in detail you can see that recessions are predictable years before they occur. They are purely and simply a result of real US household income long term negative changes. The recession, when it occurs, is the result and not the cause of real income changes, although the economic contraction does shove down incomes, but the pricing effect usually supports incomes more. In essence, the recession is the painful cure for the pre-existing malady.
Obviously we don't have 2011 Real Median Household Incomes yet, but they are going down. I can promise you that.
This should produce a deep sobriety among all those who still believe that we can inflate our way out of the current fix. Inflation cuts real median incomes decisively.
The reason that I know that the 3K plan would produce a temporary increase in GDP is that it would raise median incomes by at least 2.5K in real dollars in less than a year, and it would raise the lower income household real incomes by more than 10%. A five percent change in lower income households is usually sufficient to get us out of the pickle.
The question is - should we do it? Pretend you are the President and Congress. Would you do it? This will be the last such adventure we can afford, so spend your imaginary money wisely.
Thursday, September 15, 2011
Initial Claims, Et Al
Starts out poorly at 428,000 initial claims, previous week's claims revised up again (414-417). Four week moving average for initial claims at 419,500. The four week moving average on continuing claims moved up marginally to 3,741,000. At this point that number is more important than initial claims. We ended August at 3,729,000. EUC 20089 and state extended benefits both increased from the prior week at the end of August (these are reported with a time lag).
What this means is that overall employment is likely to be lagging. Since we are coming up on the survey week for the monthly employment report it's not what you'd hope to see.
CPI, August: CPI-U unadjusted 12 month is 3.8%. Food at home 6%, and if you compare that against the yearly increase for grocery sales in the retail report (Aug/Aug 6.8%, some of which is BTS items), and then combine that with Snarky Mark's restaurant graph, it becomes clear that the population is only eating due to food stamps.
CPI-W 12 month was at 4.3%, food at home 6.1%. This is the one currently used to calculate SS COLAs, although it's not the yearly - it's the chained increase in index. This is higher because the income segment used to calculate it is lower. The part of the population used to calculate this index spend more of their incomes on basics and more of their incomes on the lower-cost commodities in each group.
C-CPI-U 12 month is at 3.6%, food at home 5.9%. I have added coverage of this index, which is quite new, to show how much of a real impact there would be on SS recipients if this were used to calculate COLAs. It seems like there would be a very substantial impact to me! It is hard to make historical comparisons because this index is so new, but the major source of difference is that it uses the higher-income comparison base of CPI-U to start. If you want to undercut inflation by half a percentage point a year, you'll certainly save on SS payments, but those recipients will be in great pain and suffering as a result, and many will be forced onto government programs like food stamps and Medicaid, so the actual savings will be minimal over time.
Real Earnings from BLS: Note that this is calculated using CPI-U, so lower-income workers have relatively worse results and considerably higher income earners have relatively better results:
The Fed claimed that inflation was going to drop over the summer. I claimed it would rise. I leave it to you all to figure out who is right and who is wrong, but let me say that if the Fed was shooting for a target of 4%, it got there. BS about trimmed means and so forth are very much red herrings under the circs.
There is still some pent-up inflation waiting in the wings. If you look at CPI figures, you'll see that the most discretionary categories have already dropped out, so we have the classic pattern here - compensations already in effect where possible. The problem is that profit margins weren't that hot in 2010 already, so in a lot of chains there isn't compensation available and there are indeed further price increases locked in until the bottom falls out.
If persons on the FOMC really believe that they are going to help this economy by further shrinking real wages, I predict the popular result will be Jacksonian.
Industrial Production. I have major questions about this report. In particular, I'm finding it hard to believe the negative on the utilities, given the weather and other factors:
Manufacturing capacity at 75%, up from 74.4 April-June.
Ah, well, a malign providence also offers us an early take on September conditions in the Empire State Manufacturing Survey. This is kind of disgusting, so I'll just copy and paste a bit:

It's less where it is right now than the length of time spent down there in the negatives.
The number of employees index fell nine points to -5.4. Average workweek held steady at -2.2.
I was reading along looking for the pony, and I ran into this:
Finally, here's a graph which was posted by Troy over at Illusion of Prosperity:
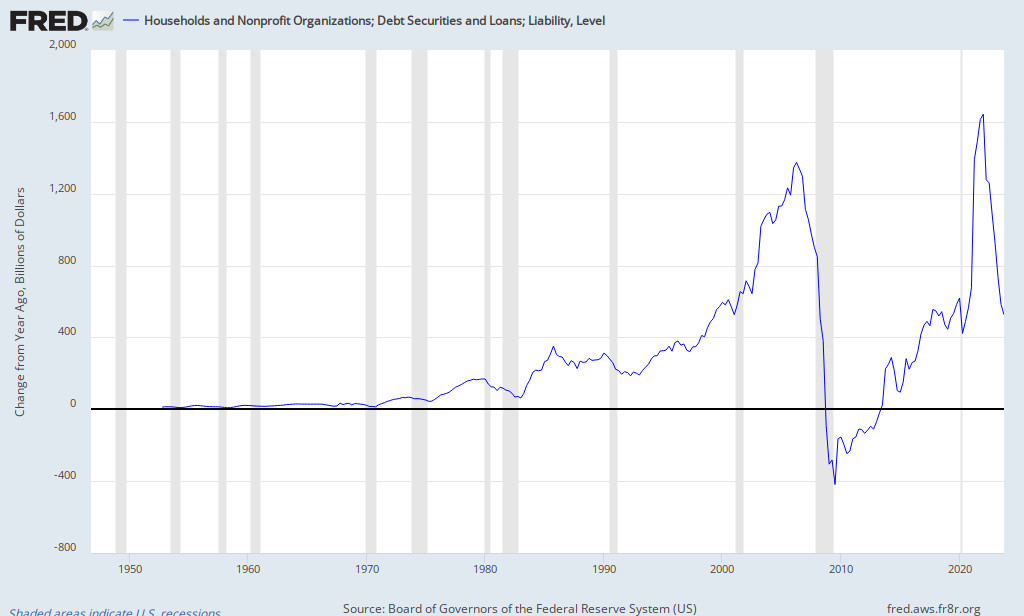
This is CMDebt, but the unit is change over the year in billions of dollars. If someone sidles up to you and offers you a good deal on some commercial mortgages, just spray Mace, scream and run. The era of abandoned strip malls is shortly going to become the era of abandoned superstores.
Our esteemed gubmint is attempting to replace the lost consumer borrowing money by borrowing the money itself. Unfortunately, it is even worse at spending money in a way that makes money than the average consumer, so GDP is not responding well.
It should be obvious that the US gubmint can't keep borrowing a trillion dollars plus a year, just as households couldn't. We have hard choices to make.
Philly Fed: (shipments index fell another 9 points from August, inventories rose.)

What this means is that overall employment is likely to be lagging. Since we are coming up on the survey week for the monthly employment report it's not what you'd hope to see.
CPI, August: CPI-U unadjusted 12 month is 3.8%. Food at home 6%, and if you compare that against the yearly increase for grocery sales in the retail report (Aug/Aug 6.8%, some of which is BTS items), and then combine that with Snarky Mark's restaurant graph, it becomes clear that the population is only eating due to food stamps.
CPI-W 12 month was at 4.3%, food at home 6.1%. This is the one currently used to calculate SS COLAs, although it's not the yearly - it's the chained increase in index. This is higher because the income segment used to calculate it is lower. The part of the population used to calculate this index spend more of their incomes on basics and more of their incomes on the lower-cost commodities in each group.
C-CPI-U 12 month is at 3.6%, food at home 5.9%. I have added coverage of this index, which is quite new, to show how much of a real impact there would be on SS recipients if this were used to calculate COLAs. It seems like there would be a very substantial impact to me! It is hard to make historical comparisons because this index is so new, but the major source of difference is that it uses the higher-income comparison base of CPI-U to start. If you want to undercut inflation by half a percentage point a year, you'll certainly save on SS payments, but those recipients will be in great pain and suffering as a result, and many will be forced onto government programs like food stamps and Medicaid, so the actual savings will be minimal over time.
Real Earnings from BLS: Note that this is calculated using CPI-U, so lower-income workers have relatively worse results and considerably higher income earners have relatively better results:
Real average weekly earnings fell 0.8 percent over the month, as a result of the 0.3 percent decrease in the average workweek and the decrease in real average hourly earnings. Since reaching a recent peak in October 2010, real average weekly earnings have fallen 2.2 percent.This probably explains more about the August retail report than babblings about "confidence". Consumers don't spend on their kids based on confidence very much; the limitation there is usually ability to spend. Difficulty in affording the basics for their kids does show up in consumer confidence surveys as a sharp negative, and boy oh boy we have seen those negatives in consumer confidence surveys! With numbers like these we are not looking at a strong holiday season.
Real average hourly earnings fell 1.9 percent, seasonally adjusted, from August 2010 to August 2011. This decrease combined with unchanged average weekly hours resulted in a 1.8 percent decrease in real average weekly earnings during the same period.
The Fed claimed that inflation was going to drop over the summer. I claimed it would rise. I leave it to you all to figure out who is right and who is wrong, but let me say that if the Fed was shooting for a target of 4%, it got there. BS about trimmed means and so forth are very much red herrings under the circs.
There is still some pent-up inflation waiting in the wings. If you look at CPI figures, you'll see that the most discretionary categories have already dropped out, so we have the classic pattern here - compensations already in effect where possible. The problem is that profit margins weren't that hot in 2010 already, so in a lot of chains there isn't compensation available and there are indeed further price increases locked in until the bottom falls out.
If persons on the FOMC really believe that they are going to help this economy by further shrinking real wages, I predict the popular result will be Jacksonian.
Industrial Production. I have major questions about this report. In particular, I'm finding it hard to believe the negative on the utilities, given the weather and other factors:
The output of consumer goods rose 0.2 percent. Consumer durables recorded an increase of 1.3 percent largely because of further gains in automotive products. The production indexes for home electronics and for appliances, furniture, and carpeting both edged up, while the output of miscellaneous goods slipped. The output of nondurable consumer goods declined 0.1 percent: A decrease in residential sales by utilities more than offset increases in the production of consumer fuels and of non-energy nondurables.The claim is that everyone just turned off their AC in August? Really? If so, it's not a good sign, especially with gasoline supplied 4-week moving average at -2.7% YoY. Because of the earlier decline in auto production IP increases during the summer were baked in, but a -3% on utilities showed up this month bringing down the headline increase to 0.2%. I'm stubbornly going to disbelieve in August figures until I see the revision next month. Usually the utility figures are reliable, though, so I probably will be forced to eat crow on this one.
Manufacturing capacity at 75%, up from 74.4 April-June.
Ah, well, a malign providence also offers us an early take on September conditions in the Empire State Manufacturing Survey. This is kind of disgusting, so I'll just copy and paste a bit:
The general business conditions index inched down one point, to -8.8. The new orders index held steady at -8.0, while the shipments index dropped sixteen points to -12.9. The inventories index, negative for a third month in a row, fell to -12.0—a sign that inventories continued to decline. After dropping significantly over the summer, the indexes for both prices paid and prices received climbed several points, suggesting that the pace of price increases picked up. Employment indexes were below zero, indicating that employment levels and hours worked fell over the month.How special. The shipments index is a hard indicator. The only bright spot was that six month expectations rose a bit. This is so beyootiful that one must admire their spirit:

It's less where it is right now than the length of time spent down there in the negatives.
The number of employees index fell nine points to -5.4. Average workweek held steady at -2.2.
I was reading along looking for the pony, and I ran into this:
The index for expected number of employees fell to zero, and the future average workweek fell to -6.5—both signs that employment is not expected to rise in coming months.Perhaps the most optimistic thing is the big fall in inventories, which tends to suggest that we reached the near-term low?
Finally, here's a graph which was posted by Troy over at Illusion of Prosperity:
This is CMDebt, but the unit is change over the year in billions of dollars. If someone sidles up to you and offers you a good deal on some commercial mortgages, just spray Mace, scream and run. The era of abandoned strip malls is shortly going to become the era of abandoned superstores.
Our esteemed gubmint is attempting to replace the lost consumer borrowing money by borrowing the money itself. Unfortunately, it is even worse at spending money in a way that makes money than the average consumer, so GDP is not responding well.
It should be obvious that the US gubmint can't keep borrowing a trillion dollars plus a year, just as households couldn't. We have hard choices to make.
Philly Fed: (shipments index fell another 9 points from August, inventories rose.)
Wednesday, September 14, 2011
(Wince) Retail Sales
I expected this, but the total retail (not adjusted for price increases) for August is at 0.0. Now, the error bar here is 0.5, so take that with a grain of salt, okay? July was revised down to 0.3. There is considerable fluctuation in seasonal adjustments for retail sales, and that is having some influence on these numbers also.
Back-to-school starts earlier in hard times and starts earlier in much of the south, where school resumes in August. Also more children live down in the south, so back-to-school probably had something to do with a decent July.
Motor vehicle sales -0.3 in August. Electronics & sporting/hobby did okay, probably due to BTS impetus, but the other discretionary categories slumped again (restaurant/bar, clothing stores, dept stores, furniture).
Adjusted for pricing changes, of course this is worse. The YoY accumulated is now dropping quite significantly; in August only 7.2%.
The producer price index for August stalled out. On the month, that is. The exception is the price of finished foods, which were up 1.1% in August.
Might as well get the uglies out of the way - the September Rail report (for August) showed pretty much a complete stall in YoY growth. Let's do the bar graphs for variety:

If Mozart were alive, he could maybe make this into a symphony. Requiem for an Expansion?
Intermodal has been the strong point in 2011, but that dropped out this summer.

If you're wondering, the long stall prior to the 2008 crash derived from credit-fueled spending and cash floating around the economy. This is not (cough) going to happen again (choke).
The rail reports are really worth reading. There's a graph in there regarding US carloads, which in August 2011 were down 13.7% from August 2006.
Canst thou say "depression" - in iambic pentameter? We need a Shakespeare to do justice to this.
One point I'd like to make - the "Panic of 2008" was a very traditional affair. There is no question that the financial hijinks had reached a ridiculous level, but as with historical panics, a downturn in the real economy caused a weakening in credit/financial asset prices that precipitated a dire financial crash. The more things change, the more they remain the same.
We have a little oomph left from a bit of an increase in wages, although real wages for most of the working population are flat to declining. But still.... I'll do the Treasury stuff in a separate report. August was pretty good in the real economy due to autos, but I am afraid we are reaching the end of that. Ward's Auto publishes an inventory summary after the end of each month, and the big fall in inventories has been substantially redressed, so now it depends more on auto sales, which recursively brings us back to the retail report, where we started.
September will be okay, because you have broken-window action and the schools are back in session which provides a bit of a kick. After that it gets harder.
The thing is, Obama's jobs plan spends a great deal of money and cannot possibly deliver, so it is hard to justify spending the money. We need results, not hope. The reaction kind of shows the skepticism, and the quoted poll shows that Independents are the most skeptical, but Independents have a strong association with being in business, so this is not surprising. In general, it seems like the public has a better grasp of the economy than the administration.
If you are going to do it at all, do it so that it has a chance of making a real difference! It is not as if ROW is throwing an optimism party.
Back-to-school starts earlier in hard times and starts earlier in much of the south, where school resumes in August. Also more children live down in the south, so back-to-school probably had something to do with a decent July.
Motor vehicle sales -0.3 in August. Electronics & sporting/hobby did okay, probably due to BTS impetus, but the other discretionary categories slumped again (restaurant/bar, clothing stores, dept stores, furniture).
Adjusted for pricing changes, of course this is worse. The YoY accumulated is now dropping quite significantly; in August only 7.2%.
The producer price index for August stalled out. On the month, that is. The exception is the price of finished foods, which were up 1.1% in August.
Might as well get the uglies out of the way - the September Rail report (for August) showed pretty much a complete stall in YoY growth. Let's do the bar graphs for variety:

If Mozart were alive, he could maybe make this into a symphony. Requiem for an Expansion?
Intermodal has been the strong point in 2011, but that dropped out this summer.
If you're wondering, the long stall prior to the 2008 crash derived from credit-fueled spending and cash floating around the economy. This is not (cough) going to happen again (choke).
The rail reports are really worth reading. There's a graph in there regarding US carloads, which in August 2011 were down 13.7% from August 2006.
Canst thou say "depression" - in iambic pentameter? We need a Shakespeare to do justice to this.
One point I'd like to make - the "Panic of 2008" was a very traditional affair. There is no question that the financial hijinks had reached a ridiculous level, but as with historical panics, a downturn in the real economy caused a weakening in credit/financial asset prices that precipitated a dire financial crash. The more things change, the more they remain the same.
We have a little oomph left from a bit of an increase in wages, although real wages for most of the working population are flat to declining. But still.... I'll do the Treasury stuff in a separate report. August was pretty good in the real economy due to autos, but I am afraid we are reaching the end of that. Ward's Auto publishes an inventory summary after the end of each month, and the big fall in inventories has been substantially redressed, so now it depends more on auto sales, which recursively brings us back to the retail report, where we started.
September will be okay, because you have broken-window action and the schools are back in session which provides a bit of a kick. After that it gets harder.
The thing is, Obama's jobs plan spends a great deal of money and cannot possibly deliver, so it is hard to justify spending the money. We need results, not hope. The reaction kind of shows the skepticism, and the quoted poll shows that Independents are the most skeptical, but Independents have a strong association with being in business, so this is not surprising. In general, it seems like the public has a better grasp of the economy than the administration.
If you are going to do it at all, do it so that it has a chance of making a real difference! It is not as if ROW is throwing an optimism party.
Tuesday, September 13, 2011
NFIB September
This was kind of a shock. Expectations for better business conditions in six months fell 11 points from July and is now 36 points below January's report. Expectations for higher real sales fell 10 points from July and is now 25 below January's report.
Current job openings dropped 3 points. Higher nominal sales over last three months fell to -9%. Note that is nominal, not real. Four percent reported borrowing as their main problem. Ninety-three percent reported all their credit needs met, which has increased from the very steady 91% reported this year.
The major factors affecting the optimism index were the six-month expectations, and the correlation between sales experience and higher real sales expectations kind of indicates that this is going to be sticky. At! !!!!! 88.1!!!!!! the optimism index is now lower than it was in Augusts of 2008, 2009 and 2010. The record low was achieved in March 2009 at 81.0. No words can express the impact that "outlook for better business conditions six months from now" had on me. Look at it for yourself:

Yes, folks, we achieved a record low on that baby. Note that the record low followed sharp degeneration in the previous two months, so it is hard to dismiss this as a one-off.
If it were not for the SuperDoc's despised but highly effective cardiac diet, I probably would have had a heart attack and died when I saw this.
Let's see - this is the indicator in NFIB reporting I watch most closely. When it gets into negative double-digit territory for three months running, as it did Nov 07, Dec 07, Jan 08, the odds of a recession are very high indeed. We have now achieved that, and I think I must abandon hope for the "skipping recession" theory.
The three month sales outlook gives you insight on timing:

Refer back to the 2008 summer reports. Note that this indicator too has been steadily dropping this year since March.
So I'd have to say the small business recession is NOW, and that the vaunted jobs bill won't have an effect. People just aren't going to hire in this environment.
Small businesses were highly supportive of Obama's election and desperately wanted health care reform. What they got was a crushing disappointment - essentially most of the burden of health care insurance market costs was left on their shoulders, and it is unquestionably cutting into hiring. With our current demographics, small businesses have as steadily aging group to cover, and that includes the business owners!
So two conclusions: Obama cannot win reelection - without this group which would best be described as "Independent" he has no chance - and we cannot avoid recession. There are about 114-120 million households in the nation. Mailing a $1,000 check to each one this month would push the sales expectations up enough to make a difference, but it would cost at least 114 billion. If you did that three more times, it probably would keep us out of recession this year and the next. It would also be cheaper than Obama's proposal.
Only very immediate action would work now. Also it would have to be sustained. I believe sending three rounds of $1,000 checks (one every three months) would do it, and it would give time for 100 billion allocated to infrastructure spending to kick in by next summer.
Obama's current proposal is quite futile and would, even if passed, take effect too late to do much.
PS: Also worth a read is the UK's Independent Commission on Banking Final Report.
Monday, September 12, 2011
New And Different
Life is like a box of Fed speeches - you never know what you are going to get. Fisher's today is definitely a new flavor:
He comes out swinging!

"The Panic of 2008." "Veterinary fix." "It is no secret that I thought the second round of quantitative easing (QE2) ran that risk. I could not support it when it was proposed because I saw no analytically sound justification that its purported benefits would outweigh its likely costs. "
You have to read this speech! The final line:
He comes out swinging!
"The Panic of 2008." "Veterinary fix." "It is no secret that I thought the second round of quantitative easing (QE2) ran that risk. I could not support it when it was proposed because I saw no analytically sound justification that its purported benefits would outweigh its likely costs. "
You have to read this speech! The final line:
With that, I’ll stop. And in the best tradition of central banking, I’d be happy to avoid answering any questions you might have.
Off To The Cardiac Unit Again Today
That's me and the Chief, for routine followup. But Europe is there too, and it could hardly be called routine.
The bottom line is that both Spain and Italy are due to flog sovereigns this week, and the ECB is going to have to buy, buy, buy!
Stark resigned on Friday. The Euro dropped against virtually all other major currencies, and some that aren't. Germany is sending up another member, but it hardly calms the roiled waters. In the meantime, this is all a bonanza for more fiscally stable countries. France is doing quite well, as is Germany, Austria, etc.
Update: 4.51% yield on Italian 2-years at the auction today. Spain has to go to the block this week, and I've got to wonder how that is going to come out. Maybe they should cancel it. French banks getting cut up badly.
PS: And no, the French explosion didn't happen at a nuclear plant. Real details, not very sensational.
Sunday, September 11, 2011
Ten Years On It Does Not Get Better
Carl at No Oil For Pacifists wrote a moving post regarding 9/11.
Friday, September 09, 2011
Well, well
Obama's speech and his proposal for the American Jobs Act:
Preliminary comments:
Update: Fact Check on the "paid for" claim:
Not that European problems are good for the US. They aren't. But they sure are good for US bondholders. So it really doesn't matter that the US is about to up the debt limit to about 15.2 trillion so that Treasury can sell bonds, because frankly, US repayment worries are in the future, and Euro worries are, like man, RIGHT NOW. Right now, our banks are a parking lot for a lot of global money and our Treasuries are liquid as can be.
- This is the text as published at whitehouse.gov.
- There are enhanced graphics (more slides) and a fact sheet at the blog.
Preliminary comments:
- It's too darned bad that this serious an approach couldn't have been implemented in the first stimulus bill early in 2009, when it would have made more of a difference and would have been far easier to afford. Much of the money in the first stimulus bill was simply thrown away.This appears to be a much more serious attempt at real stimulus.
- Temporary measures and tax credits are not going to be very effective at creating jobs. The measures described on the business side will tend to create more business investment (expensing) and generate a flow of funds to help a business like Mr. Packaging Guy's afford to buy new equipment. Also a lot of business owners will buy new cars. So it is not all bad. But any temporary tax cut won't produce much more employment, because....
- The White House doesn't "get" the problem for business owners involved in unemployment taxes. One reason why small business owners (and indeed all business owners) are reluctant to hire is unemployment taxes and experience ratings. Remember, unemployment taxes apply to almost ALL your payroll. I will expand on this point further, but between the kind of wretched failure involved in the health reform bill and the fear of firing involved in the unemployment tax club, many businesses will not respond to temporary funding measures - they have to make things work over the long term. Here is a document produced by DOL that lists the basic provisions for the states. On the extreme right hand column, you will see three rates. The top is the minimum. The second from the top is the maximum. The bottom is the rate that a new business will pay (usually an average rate). Because hiring a worker that the business may not be able to keep can potentially have huge costs over a couple of years (2% of 80% of payroll for three years?), many businesses cannot hire anyone. They can hire temps, but they can't hire permanent workers.
- Essentially, the payroll tax cuts involved are so large that they represent an abandonment of the SS program. If this bill passes as scheduled, the tax increase scheduled for 2013 (fixed) would be so huge that it would tip the economy into recession then or increase an existing recession.
Update: Fact Check on the "paid for" claim:
THE FACTS: Obama did not spell out exactly how he would pay for the measures contained in his nearly $450 billion American Jobs Act but said he would send his proposed specifics in a week to the new congressional supercommittee charged with finding budget savings. White House aides suggested that new deficit spending in the near term to try to promote job creation would be paid for in the future - the "out years," in legislative jargon - but they did not specify what would be cut or what revenues they would use.Greek 2-year yields are over 57%. Greece is shocked - just SHOCKED over rumors of default. I would say that this is a level of fantasy equivalent to the "paid for" claim. Still, whatever the US does right now is overshadowed by European problems.
Not that European problems are good for the US. They aren't. But they sure are good for US bondholders. So it really doesn't matter that the US is about to up the debt limit to about 15.2 trillion so that Treasury can sell bonds, because frankly, US repayment worries are in the future, and Euro worries are, like man, RIGHT NOW. Right now, our banks are a parking lot for a lot of global money and our Treasuries are liquid as can be.
![]()
