 MaxedOutMama
Friday, July 31, 2009
GDP Revisions And Our General Situation
With this advance estimate, BEA is incorporating a substantial revision. The pdf (51 pages) release is here. Note: all dollar figures listed here unless otherwise noted are annualized in billions and 2005 dollar-indexed.
In these releases, they are incorporating a current dollar change indexed to 2005 as well as other changes described in the release. Q2 is estimated at -1%. The new trajectory by quarter, beginning in the fourth quarter of 2007 and ending in Q2 2009 is:
As a better index of the depth of this thing, you will see (go to page 28) that real GDP for Q2 (12,892.4)has rolled back to a level between fourth quarter 2005 (12,748.7) and first quarter 2006 (12,915.9). This is a remarkably deep downturn. Consider the situation of the states, which are dealing with revenues even lower than those of 4 years ago, a larger population requiring more in the way of social services, and the beginnings of the retirement budget buster. They are in deep - it is not just CA.
A look at government expenditures tells the tale of rapidly rising federal expenditures as state expenditures continue to drop. Beginning in Q2 2008:
Another way to measure the depth of the downturn is to figure percentage decline. From Q4 2007 to Q2 2009, 2005-dollar indexed GDP has declined 3.7%. From the peak, which occurred Q2 2008 (due to the stimulus), GDP has declined about 3.9%.
Gross private domestic investment advance for Q2 2009 is estimated as 1,471.9. That is more than 25% below the averages for 2005, 2006, and 2007. It is also well below the ranges in 2008. In Q2 2008, GPDI was 2026.5. The figures for GPDI (annualized), which is the real forward driver of the US economy, are below the annualized figures going back to 1998. We have a significant problem.
Economies which are heavily weighted toward manufacturing have rapid collapses of GDP during hefty recessions such as this, but economies that are weighted more toward consumption (such as the US, or, to take an extreme example, the UK) show a pattern of smaller declines in the beginning of major international economic downturns, but a more persistent decline later in the cycle as the impacts of the manufacturing slow consumption.
2005 dollar PCE for Q2 2009 (remember, this is an advance estimate) is given as 9,180.5, which is equivalent to PCE for Q4 2006. Thus, our consumption is still out of line with our economic fundamentals.
I really was not all that interested in this GDP release. I am waiting for the July tax receipts, and especially FUT. What happens next in the US economy is going to depend mostly on how the small businesses are holding up.
In the stores, I see havoc. Food prices are steadily rolling back to a degree which would hint at deflation. The combination of this:

Combined with this:

Presents a highly disturbing picture. The Fed has been desperately attempting to redress the situation by reducing the average interest rates that households pay, and thus the percentage of income consumed by debt repayments:

Which looks fine and dandy, until one realizes that most of the compensation has occurred in mortgage payments and extremely low mortgage interest rates, the bulk of which are produced by government guarantees and not the market. Interest rates will rise, and that will leave a large proportion of the homeowner population unable to refinance. With extremely high CLTVs, most of this population will be unable to get second lien home equity loans; ergo, the capacity of the US consumer economy to absorb new debt in the future will be quite constrained. Add into that the movement of large numbers of households into the retiree/near retiree demographic group, and the cautious analyst or loan officer realizes that we need to turn to the production sector for growth.
And that is when one has a heart attack:

Note the amplitude of the dip in comparison to those in former recessions. It will rebound, but it will not rebound in a manner that is going to produce much in the way of gross private domestic investment over the next few years, because of capacity utilization:

Note that we have managed to top the 82 situation, which was truly wretched. And note that after the pits, matters revived quite handily. However, one now must scroll back up and look at household debt loads then versus now, and then also factor in the Reagan tax cuts, which inserted a massive stimulus into the US economy.
We could do that then, and we simply can't now, because of the federal debt load and retiree obligations. Short of whacking the 65 and older crowd, there is no way out but to give them some portion of their retirement benefits, which will require substantially increasing federal personal taxes.
So, now maybe you can understand why I have been desperately trying to get some feeling for one burning question, which surmounts all else in my mind:
HOW LOW A GROWTH RATE CAN THIS ECONOMY SUSTAIN WITHOUT REVERTING TO ANOTHER CYCLE OF DECLINE?
I live with this question. I breathe with this question. I ponder this question in my sleep (literally). I have not yet figured out the answer, but it's not looking good. I doubt very much that the US economy can put in a year of growth around 1% without reverting to a decline, and I still have the organic growth rate (the top achievable without creating an inflationary cycle or without creating massive new debt loads) at less than 2% - somewhere around 1.7% to 1.8%.
It would be quite a hat trick to hit a policy range that narrow accurately.
In these releases, they are incorporating a current dollar change indexed to 2005 as well as other changes described in the release. Q2 is estimated at -1%. The new trajectory by quarter, beginning in the fourth quarter of 2007 and ending in Q2 2009 is:
+2.1%, -0.7%, +1.5%, -2.7%, -5.4%, -6.4%, -1.0%.This revision comes closer to my own figures, except I have Q2 at more like -1.8 or -1.9. GDP gets revised and revised, even after the "final" figures come out, so these changes aren't surprising. Nonetheless, I am sure they will spawn a conspiracy theory or two.
As a better index of the depth of this thing, you will see (go to page 28) that real GDP for Q2 (12,892.4)has rolled back to a level between fourth quarter 2005 (12,748.7) and first quarter 2006 (12,915.9). This is a remarkably deep downturn. Consider the situation of the states, which are dealing with revenues even lower than those of 4 years ago, a larger population requiring more in the way of social services, and the beginnings of the retirement budget buster. They are in deep - it is not just CA.
A look at government expenditures tells the tale of rapidly rising federal expenditures as state expenditures continue to drop. Beginning in Q2 2008:
Federal: 961.3; 991.6; 1007.3; 996.3; 1022.4State and local constraints are going to play an ever larger part in the years going forward. They are raising taxes quite uniformly, and it is mostly a regressive hit in the localities.
State & Local: 1,546.6; 1,547.0; 1,539.3; 1,533.3; 1,542.6
Fed/St&Loc ratio: 0.62; 0.64; 0.65; 0.65; 0.66
Another way to measure the depth of the downturn is to figure percentage decline. From Q4 2007 to Q2 2009, 2005-dollar indexed GDP has declined 3.7%. From the peak, which occurred Q2 2008 (due to the stimulus), GDP has declined about 3.9%.
Gross private domestic investment advance for Q2 2009 is estimated as 1,471.9. That is more than 25% below the averages for 2005, 2006, and 2007. It is also well below the ranges in 2008. In Q2 2008, GPDI was 2026.5. The figures for GPDI (annualized), which is the real forward driver of the US economy, are below the annualized figures going back to 1998. We have a significant problem.
Economies which are heavily weighted toward manufacturing have rapid collapses of GDP during hefty recessions such as this, but economies that are weighted more toward consumption (such as the US, or, to take an extreme example, the UK) show a pattern of smaller declines in the beginning of major international economic downturns, but a more persistent decline later in the cycle as the impacts of the manufacturing slow consumption.
2005 dollar PCE for Q2 2009 (remember, this is an advance estimate) is given as 9,180.5, which is equivalent to PCE for Q4 2006. Thus, our consumption is still out of line with our economic fundamentals.
I really was not all that interested in this GDP release. I am waiting for the July tax receipts, and especially FUT. What happens next in the US economy is going to depend mostly on how the small businesses are holding up.
In the stores, I see havoc. Food prices are steadily rolling back to a degree which would hint at deflation. The combination of this:
Combined with this:
Presents a highly disturbing picture. The Fed has been desperately attempting to redress the situation by reducing the average interest rates that households pay, and thus the percentage of income consumed by debt repayments:
Which looks fine and dandy, until one realizes that most of the compensation has occurred in mortgage payments and extremely low mortgage interest rates, the bulk of which are produced by government guarantees and not the market. Interest rates will rise, and that will leave a large proportion of the homeowner population unable to refinance. With extremely high CLTVs, most of this population will be unable to get second lien home equity loans; ergo, the capacity of the US consumer economy to absorb new debt in the future will be quite constrained. Add into that the movement of large numbers of households into the retiree/near retiree demographic group, and the cautious analyst or loan officer realizes that we need to turn to the production sector for growth.
And that is when one has a heart attack:
Note the amplitude of the dip in comparison to those in former recessions. It will rebound, but it will not rebound in a manner that is going to produce much in the way of gross private domestic investment over the next few years, because of capacity utilization:
Note that we have managed to top the 82 situation, which was truly wretched. And note that after the pits, matters revived quite handily. However, one now must scroll back up and look at household debt loads then versus now, and then also factor in the Reagan tax cuts, which inserted a massive stimulus into the US economy.
We could do that then, and we simply can't now, because of the federal debt load and retiree obligations. Short of whacking the 65 and older crowd, there is no way out but to give them some portion of their retirement benefits, which will require substantially increasing federal personal taxes.
So, now maybe you can understand why I have been desperately trying to get some feeling for one burning question, which surmounts all else in my mind:
HOW LOW A GROWTH RATE CAN THIS ECONOMY SUSTAIN WITHOUT REVERTING TO ANOTHER CYCLE OF DECLINE?
I live with this question. I breathe with this question. I ponder this question in my sleep (literally). I have not yet figured out the answer, but it's not looking good. I doubt very much that the US economy can put in a year of growth around 1% without reverting to a decline, and I still have the organic growth rate (the top achievable without creating an inflationary cycle or without creating massive new debt loads) at less than 2% - somewhere around 1.7% to 1.8%.
It would be quite a hat trick to hit a policy range that narrow accurately.
Saturday, July 25, 2009
Rural Millionaire's Asset Protection Feature Of Affordable Health Care
Among the things that completely amazed me about this bill was the fact that, out of the abundant kindness of your hearts, the government is apparently planning to provide massive subsidies to the genuinely wealthy. There is no asset test at all for the public subsidies for healthcare premiums and copays in this bill. None. Some people with millions of dollars of assets would qualify for thousands of dollars of public money some years.
Is this a good use of the public funds, especially when you consider our government debt held by the public, which was 5.1 trillion as of 12/31/2007, and as of Friday, July 24th 2009, had risen to 7.26 trillion? Look it up yourself. That is quite some burden we are bequeathing our children.
Perhaps this is a feature incorporated by Ivy League law school dropouts who found that law school was just too unbearably sordid for their refined sensibilities, and so left to go into public service where, you know, they could "really make a difference". Or perhaps it is a feature derived from years of rantings in NYC and DC about the stupidity of the violent, stupid and unteachable hominids roaming Kansas and various other districts of flyover country, including but not limited to Ivy professors who are waiting for some Jane Goodall type to come along and teach them how to communicate with the Homo Sapiens Plumberus (a primitive hominid found in the outskirts of urbania along with feral cats, coyotes, and urban foxes). This perspective on the great unwashed was capped by our current president's musings over the desperate, haunted lives of small town Americans, who are forced to turn to religion because nothing else in their lives works any more. I'm not sure that the movers and shakers grasp the concept that some of these folks are exceedingly comfortable.
This aspect of the bill leaped right out of me, because I immediately realized that some years the Ivy League professors were going to be giving me a lot of money. Tears of laughter rolled down my face as I blessed Jane Smiley and law school dropouts. Eventually, a residual sense of public responsibility and basic ethics kicked in, and I realized that this feature of the bill was a major flaw.
There are a lot of people like me - people with high assets who may not have a lot of income in any particular year. Based on what I've seen over the last few years, there may be a lot more of us now than formerly. Perhaps the Ivy League professors are too communication-impaired to be able to discuss such things with the flyover trogs, but many of those trogs are holding large non-dollar assets. There is no need to go into this too deeply, but if Ron Paul had his way and we had a hard currency, literal convoys of Brinks trucks packed full of gold and silver would have been rolling up 95 and 75 from Florida into Georgia.
A lot of my friends and acquaintances sold out of Florida land and Florida banks and converted the proceeds out of dollar-denominated assets out of a violent, unteachably ignorant suspicion that the financial system had overreached itself and a major crash was coming. And a bulk of the liberated proceeds went into the type of hard assets that produce no income at all, such as land and so forth.
I strongly suspect that there are a lot of urban millionaires who are carefully managing their assets who may be reporting very little income this year either. You recognize some losses to offset our gains, and wala! The tax bite is very little.
In any case, surely there should be a net worth provision in this bill that blocks subsidies for wealthy individuals.
The section which I am discussing begins on page 132, and it is Section 242 - Affordable Credit Eligible Individuals, who are defined as legal residents not eligible for Medicaid and having family incomes below 400 percent of the Federal Poverty Level (FPL), and who are not covered by an employee health plan that costs 11% or less of their family income.
Very generous subsidies are provided for such individuals who are buying insurance through the health insurance exchange. The subsidies, which are on a sliding scale related to income, cover both the premiums and increase the benefits paid. This is the table (found on page 137) in Section 243:

You should be able to click on it for a larger image.
Federal poverty levels for 2009 can be found here.
This is the basic table:
There are different tables at the link for Alaska and Hawaii.
So the way this works out is that that a family of 2 can have MAGI (AGI plus tax-exempt interest) of $29,140 and qualify for federal health insurance and medical benefit payments as follows:
The annual insurance premium would be limited to $1,457. Beyond that, the federal government would cover it. For all actual medical expenses covered by the plan, 93% of them would be covered by the government. So let's say a 30% share of medical payments charges of $40,000 for would produce a $10,000 bill for the normal subscriber (this portion is capped at $5,000 individual and $10,000 family) under the bill. This family would only pay 1200 0 of cost-sharing that a non-subsidized individual would pay, this family would only pay $2,800. That total subsidy for this example year is well over $10,000.
All of that's very fine if this is a family without assets. But what if the family owns over 2 million in assets? The example I have given is not that unusual for many of my acquaintances. Or, for that matter, for the Chief and I. When you have major assets and no debt, you don't need much in income and a lot of years you won't be trying to maximize your income. Some years you will show a very high income, but most years you won't.
And suppose you are an early-retired couple with a house (paid off), a farm and $1,000,000 in bonds paying you 20K a year? You are still going to get a nice subsidy from the government. This is ridiculous.
Particularly in rural areas, you can live very well debt free with very low cash income if you have land. Families have hogs, or chickens, fish ponds, hunt a few deer. Let your neighbor hunt, you get wood. The ground has this interesting feature - if you put seeds in it, food pops up. Rural families can have major assets with very low cash income, especially when interest rates are so low. The other part of it is that when you are holding large chunks of property in non-dollar assets, you can go to a bank and get money any time. Even today, few banks are unwilling to give you 100K on a million-dollar asset. If you have assets, you don't need income most years. Low income doesn't mean that you are poor.
There are parts of this bill that just seem completely crazy to me. It's definitely a rush job that has not been analyzed or thought through. That, or Congress Critters are strongly in favor of asset protection plans for millionaires, which is, I suppose, possible.
Is this a good use of the public funds, especially when you consider our government debt held by the public, which was 5.1 trillion as of 12/31/2007, and as of Friday, July 24th 2009, had risen to 7.26 trillion? Look it up yourself. That is quite some burden we are bequeathing our children.
Perhaps this is a feature incorporated by Ivy League law school dropouts who found that law school was just too unbearably sordid for their refined sensibilities, and so left to go into public service where, you know, they could "really make a difference". Or perhaps it is a feature derived from years of rantings in NYC and DC about the stupidity of the violent, stupid and unteachable hominids roaming Kansas and various other districts of flyover country, including but not limited to Ivy professors who are waiting for some Jane Goodall type to come along and teach them how to communicate with the Homo Sapiens Plumberus (a primitive hominid found in the outskirts of urbania along with feral cats, coyotes, and urban foxes). This perspective on the great unwashed was capped by our current president's musings over the desperate, haunted lives of small town Americans, who are forced to turn to religion because nothing else in their lives works any more. I'm not sure that the movers and shakers grasp the concept that some of these folks are exceedingly comfortable.
This aspect of the bill leaped right out of me, because I immediately realized that some years the Ivy League professors were going to be giving me a lot of money. Tears of laughter rolled down my face as I blessed Jane Smiley and law school dropouts. Eventually, a residual sense of public responsibility and basic ethics kicked in, and I realized that this feature of the bill was a major flaw.
There are a lot of people like me - people with high assets who may not have a lot of income in any particular year. Based on what I've seen over the last few years, there may be a lot more of us now than formerly. Perhaps the Ivy League professors are too communication-impaired to be able to discuss such things with the flyover trogs, but many of those trogs are holding large non-dollar assets. There is no need to go into this too deeply, but if Ron Paul had his way and we had a hard currency, literal convoys of Brinks trucks packed full of gold and silver would have been rolling up 95 and 75 from Florida into Georgia.
A lot of my friends and acquaintances sold out of Florida land and Florida banks and converted the proceeds out of dollar-denominated assets out of a violent, unteachably ignorant suspicion that the financial system had overreached itself and a major crash was coming. And a bulk of the liberated proceeds went into the type of hard assets that produce no income at all, such as land and so forth.
I strongly suspect that there are a lot of urban millionaires who are carefully managing their assets who may be reporting very little income this year either. You recognize some losses to offset our gains, and wala! The tax bite is very little.
In any case, surely there should be a net worth provision in this bill that blocks subsidies for wealthy individuals.
The section which I am discussing begins on page 132, and it is Section 242 - Affordable Credit Eligible Individuals, who are defined as legal residents not eligible for Medicaid and having family incomes below 400 percent of the Federal Poverty Level (FPL), and who are not covered by an employee health plan that costs 11% or less of their family income.
Very generous subsidies are provided for such individuals who are buying insurance through the health insurance exchange. The subsidies, which are on a sliding scale related to income, cover both the premiums and increase the benefits paid. This is the table (found on page 137) in Section 243:

You should be able to click on it for a larger image.
Federal poverty levels for 2009 can be found here.
This is the basic table:
| Persons in family | Poverty guideline |
|---|---|
| 1 | $10,830 |
| 2 | 14,570 |
| 3 | 18,310 |
| 4 | 22,050 |
| 5 | 25,790 |
| 6 | 29,530 |
| 7 | 33,270 |
| 8 | 37,010 |
| For families with more than 8 persons, add $3,740 for each additional person. | |
There are different tables at the link for Alaska and Hawaii.
So the way this works out is that that a family of 2 can have MAGI (AGI plus tax-exempt interest) of $29,140 and qualify for federal health insurance and medical benefit payments as follows:
The annual insurance premium would be limited to $1,457. Beyond that, the federal government would cover it. For all actual medical expenses covered by the plan, 93% of them would be covered by the government. So let's say a 30% share of medical payments charges of $40,000 for would produce a $10,000 bill for the normal subscriber (this portion is capped at $5,000 individual and $10,000 family) under the bill. This family would only pay 1200 0 of cost-sharing that a non-subsidized individual would pay, this family would only pay $2,800. That total subsidy for this example year is well over $10,000.
All of that's very fine if this is a family without assets. But what if the family owns over 2 million in assets? The example I have given is not that unusual for many of my acquaintances. Or, for that matter, for the Chief and I. When you have major assets and no debt, you don't need much in income and a lot of years you won't be trying to maximize your income. Some years you will show a very high income, but most years you won't.
And suppose you are an early-retired couple with a house (paid off), a farm and $1,000,000 in bonds paying you 20K a year? You are still going to get a nice subsidy from the government. This is ridiculous.
Particularly in rural areas, you can live very well debt free with very low cash income if you have land. Families have hogs, or chickens, fish ponds, hunt a few deer. Let your neighbor hunt, you get wood. The ground has this interesting feature - if you put seeds in it, food pops up. Rural families can have major assets with very low cash income, especially when interest rates are so low. The other part of it is that when you are holding large chunks of property in non-dollar assets, you can go to a bank and get money any time. Even today, few banks are unwilling to give you 100K on a million-dollar asset. If you have assets, you don't need income most years. Low income doesn't mean that you are poor.
There are parts of this bill that just seem completely crazy to me. It's definitely a rush job that has not been analyzed or thought through. That, or Congress Critters are strongly in favor of asset protection plans for millionaires, which is, I suppose, possible.
Thursday, July 23, 2009
Don't Take The Aspirin
I have indeed read the health care bill, and by reading I mean an exercise such as demonstrated by Firebrand's work on one section, in which one traces back all the threads. It is a difficult and time-consuming practice, and it is one in which I have a lot of expertise in bank-related law.
Firebrand's work is admirable, but she completely missed the point about what is required under the legislation and therefore the effect. The change to the law about the Medicare-covered consultation about end of life care (begins on page 425) which concerned commenters is this, beginning on page 426, which is one item on the list of what such a consultation must include in order to be billable under Medicare:
Title III is the real oomph. It begins on page 443. It introduces the concept of ACOs (Accountable Care Organizations) that are designed to create incentive structures to "reduce the growth of expenditures and improve health outcomes in the provision of items and services under this title to applicable beneficiaries". (I removed the line numbering.)
To fully understand this section, you have to realize that Medicare significantly underpays primary care physicians, which is stupid, because that is where the bulk of your cost savings are. It is only good primary care that will keep you up and moving and out of the hospital. That is the last place you want to underpay.
Anyway, they have come up with a new way for primary care physicians to make a living. They are going to pay them to cut costs now through these ACOs, which may include hospitals, etc, and must include a group of physcians organized legally so that it can distribute incentives and must include enough physcians to qualify according to the new Secretary's rules. How are the incentives determined?
You get it? Under this bill, primary care physicians can literally be paid almost dollar for dollar for every test they don't prescribe, every medication they don't prescribe, etc. And there is no consideration of long-term costs - this is a year-by-year thing. If you tell old SoAndSo to go home and take an aspirin when you suspect he is having a stroke instead of sending him to the hospital, you get paid for that cost-saving measure. If some recalcitrant doc does make the mistake of sending old SoAndSo to the emergency room, it doesn't matter. The physician at the emergency room will be paid to tell old SoAndSo to go home and take an aspirin. (This, by the way, really happened. Said old geezer did duly die very cheaply at home that afternoon for only the cost of an aspirin.)
Now if you are thinking that my interpretation of this segment is a bit alarmist, consider the implications of the following (page 454) provisions regarding this hyah incentive program to kill the old farts cheaply:
Firebrand's work is admirable, but she completely missed the point about what is required under the legislation and therefore the effect. The change to the law about the Medicare-covered consultation about end of life care (begins on page 425) which concerned commenters is this, beginning on page 426, which is one item on the list of what such a consultation must include in order to be billable under Medicare:
9 ‘‘(F)(i) Subject to clause (ii), an explanation ofThis adds a requirement to the existing schedule of paid-for services. In order to get paid by Medicare, the physician must include a blurb about DNRs and the like. This is an essential change to the law. The requirement to include this explanation is modified by clause II, which makes this only mandatory when the state has set up an organized structure for this sort of thing and for the provider to be following what is, essentially, a set script repesenting the interests of such entities such as the state health authorities, hospice association, etc. Thus, for example, the materials which have been developed by say, Catholic medical associations will NOT be part of this required counseling. Another required portion of this consultation is information about hospice benefits and programs. Interestingly, a nurse practicioner or physician's assistant is a qualified provider under this clause. All of the above is part of paragraph 1 under Section 1233. 2 contains the definition of provider. 3 contains the following provision about more frequent paid-for consultations if the health status changes, such as:
10 orders regarding life sustaining treatment or similar
11 orders, which shall include—
12 ‘‘(I) the reasons why the development of
13 such an order is beneficial to the individual and
14 the individual’s family and the reasons why
15 such an order should be updated periodically as
16 the health of the individual changes;
17 ‘‘(II) the information needed for an indi18
vidual or legal surrogate to make informed deci19
sions regarding the completion of such an
20 order; and
21 ‘‘(III) the identification of resources that
22 an individual may use to determine the require23
ments of the State in which such individual re24
sides so that the treatment wishes of that indi25
vidual will be carried out if the individual is un-
1 able to communicate those wishes, including re2
quirements regarding the designation of a sur3
rogate decisionmaker (also known as a health
4 care proxy).
includingAnd here we discover that physicians, nurses, PAs and so forth will be paid under this clause for signing a DNR order or another similar order restricting treatment:
5 diagnosis of a chronic, progressive, life-limiting disease, a
6 life-threatening or terminal diagnosis or life-threatening
7 injury, or upon admission to a skilled nursing facility, a
8 long-term care facility (as defined by the Secretary), or
9 a hospice program.
13 ‘‘(5)(A) For purposes of this section, the term ‘orderSo there is an incentive in place. This section should be read in tandem with the measures for measuring end-of-life treatment quality and of developing patient aids for education. Basically this whole section is created to try to get people to set advance directives, which usually do limit care. Personally I am strongly in favor of people sitting down and thinking this sort of stuff over, but one must be realistic about this. Under current law, if a hospital decides care is "futile", they can generally yank the plug anyway. We are rapidly approaching the point at which a certain measures, including tube feeding and liquids, are going to be routinely denied to many elderly persons deemed to be close to the end of their lives.
14 regarding life sustaining treatment’ means, with respect
15 to an individual, an actionable medical order relating to
16 the treatment of that individual that—
17 ‘‘(i) is signed and dated by a physician (as de18
fined in subsection (r)(1)) or another health care
19 professional (as specified by the Secretary and who
20 is acting within the scope of the professional’s au21
thority under State law in signing such an order, in22
cluding a nurse practitioner or physician assistant)
23 and is in a form that permits it to stay with the in24
dividual and be followed by health care professionals
25 and providers across the continuum of care;
1 ‘‘(ii) effectively communicates the individual’s
2 preferences regarding life sustaining treatment, in3
cluding an indication of the treatment and care de4
sired by the individual;
5 ‘‘(iii) is uniquely identifiable and standardized
6 within a given locality, region, or State (as identified
7 by the Secretary); and
8 ‘‘(iv) may incorporate any advance directive (as
9 defined in section 1866(f)(3)) if executed by the in10
dividual.
11 ‘‘(B) The level of treatment indicated under subpara12
graph (A)(ii) may range from an indication for full treat13
ment to an indication to limit some or all or specified
14 interventions. Such indicated levels of treatment may in15
clude indications respecting, among other items—
16 ‘‘(i) the intensity of medical intervention if the
17 patient is pulse less, apneic, or has serious cardiac
18 or pulmonary problems;
19 ‘‘(ii) the individual’s desire regarding transfer
20 to a hospital or remaining at the current care set21
ting;
22 ‘‘(iii) the use of antibiotics; and
23 ‘‘(iv) the use of artificially administered nutri24
tion and hydration.’’.
Title III is the real oomph. It begins on page 443. It introduces the concept of ACOs (Accountable Care Organizations) that are designed to create incentive structures to "reduce the growth of expenditures and improve health outcomes in the provision of items and services under this title to applicable beneficiaries". (I removed the line numbering.)
To fully understand this section, you have to realize that Medicare significantly underpays primary care physicians, which is stupid, because that is where the bulk of your cost savings are. It is only good primary care that will keep you up and moving and out of the hospital. That is the last place you want to underpay.
Anyway, they have come up with a new way for primary care physicians to make a living. They are going to pay them to cut costs now through these ACOs, which may include hospitals, etc, and must include a group of physcians organized legally so that it can distribute incentives and must include enough physcians to qualify according to the new Secretary's rules. How are the incentives determined?
‘‘(i) IN GENERAL.—The SecretarySo the Secretary establishes an amount, and if you come in cheaper for what is actually spent on patient care than the expected, you get some portion of it:
10 shall establish a performance target for
11 each qualifying ACO comprised of a base
12 amount (described in clause (ii)) increased
13 to the current year by an adjustment fac14
tor (described in clause (iii)). Such a tar15
get may be established on a per capita
16 basis, as the Secretary determines to be
17 appropriate.
18 ‘‘(ii) BASE AMOUNT.—For purposes of
19 clause (i), the base amount in this sub20
paragraph is equal to the average total
21 payments (or allowed charges) under parts
22 A and B (and may include part D, if the
23 Secretary determines appropriate) for ap24
plicable beneficiaries for whom the quali25
fying ACO furnishes items and services in
1 a base period determined by the Secretary.
2 Such base amount may be determined on
3 a per capita basis.
1 ‘‘(i) IN GENERAL.—Subject to clauseThe limitation on the incentive payments is that they can't be more than the total difference between expected cost and actual cost.
2 (ii), a qualifying ACO that meet or exceeds
3 annual quality and performance targets for
4 a year shall receive an incentive payment
5 for such year equal to a portion (as deter6
mined appropriate by the Secretary) of the
7 amount by which payments under this title
8 for such year relative are estimated to be
9 below the performance target for such
10 year, as determined by the Secretary. The
11 Secretary may establish a cap on incentive
12 payments for a year for a qualifying ACO.
You get it? Under this bill, primary care physicians can literally be paid almost dollar for dollar for every test they don't prescribe, every medication they don't prescribe, etc. And there is no consideration of long-term costs - this is a year-by-year thing. If you tell old SoAndSo to go home and take an aspirin when you suspect he is having a stroke instead of sending him to the hospital, you get paid for that cost-saving measure. If some recalcitrant doc does make the mistake of sending old SoAndSo to the emergency room, it doesn't matter. The physician at the emergency room will be paid to tell old SoAndSo to go home and take an aspirin. (This, by the way, really happened. Said old geezer did duly die very cheaply at home that afternoon for only the cost of an aspirin.)
Now if you are thinking that my interpretation of this segment is a bit alarmist, consider the implications of the following (page 454) provisions regarding this hyah incentive program to kill the old farts cheaply:
9 ‘‘(4) LIMITATIONS ON REVIEW.—There shall beSo, in conclusion, if you are on Medicare and you have a headache and your doctor tells you to go to the emergency room pronto because he thinks you are having a stroke, DON'T TAKE THE ASPIRIN.
10 no administrative or judicial review under section
11 1869, section 1878, or otherwise of—
12 ‘‘(A) the elements, parameters, scope, and
13 duration of the pilot program;
14 ‘‘(B) the selection of qualifying ACOs for
15 the pilot program;
16 ‘‘(C) the establishment of targets, meas17
urement of performance, determinations with
18 respect to whether savings have been achieved
19 and the amount of savings;
20 ‘‘(D) determinations regarding whether, to
21 whom, and in what amounts incentive payments
22 are paid; and
23 ‘‘(E) decisions about the extension of the
24 program under subsection (g), expansion of the
1 program under subsection (h) or extensions
2 under subsection (i).
Friday, July 17, 2009
Nightsbane
338 pages to read, 338 pages to read, get one through, click it along, 337 pages to read....
Lalalalala. Thank you for your emailed support. There is something about this type of thinking that remedies the soul-warping effects of 1,018 pages of exposure to the thought processes of people (a la Pelosi) who are convinced that adding the numbers up is a vile and irrational effort:

To which I can only add this: The taxation rates in those Nordic countries are extremely high. They actually pay for their socialized medicine, which puts them a giant step ahead of this exercise in nihilism. You can have socialized medicine with very high tax rates. You cannot have socialized medicine without very high tax rates.
The doofuses who composed this attack on centuries of post-enliightenment western thought have not grasped this principle. See this very short survey of OECD tax rates from which this table is drawn. You want it, you gotta pay for it, this bill doesn't pay for it. Therefore it won't work, QED. Dingbats.
By now I would already have descended into clinical depression were it not for a timely find on the estimable Coyote Blog. I tried taking the Shrink's advice - take plenty of breaks. Yeah, sure. You can't break because you'll go break windows just to relieve your feelings.
However, his advice to employ humor is working well. Here is the video that saved my sanity:
And yes, that's exactly what this is.
Lalalalala. Thank you for your emailed support. There is something about this type of thinking that remedies the soul-warping effects of 1,018 pages of exposure to the thought processes of people (a la Pelosi) who are convinced that adding the numbers up is a vile and irrational effort:
Specifically, let’s also stop citing the Nordic countries as examples. The temporary success of (comparatively speaking) twelve herring-eating homogenous people is not an example that applies to anything outside of perhaps Minnesota, and they elected Stuart Smalley, so under any system they need serious free anti-psychotic medication immediately.

To which I can only add this: The taxation rates in those Nordic countries are extremely high. They actually pay for their socialized medicine, which puts them a giant step ahead of this exercise in nihilism. You can have socialized medicine with very high tax rates. You cannot have socialized medicine without very high tax rates.
The doofuses who composed this attack on centuries of post-enliightenment western thought have not grasped this principle. See this very short survey of OECD tax rates from which this table is drawn. You want it, you gotta pay for it, this bill doesn't pay for it. Therefore it won't work, QED. Dingbats.
By now I would already have descended into clinical depression were it not for a timely find on the estimable Coyote Blog. I tried taking the Shrink's advice - take plenty of breaks. Yeah, sure. You can't break because you'll go break windows just to relieve your feelings.
However, his advice to employ humor is working well. Here is the video that saved my sanity:
And yes, that's exactly what this is.
Thursday, July 16, 2009
I'll Read The Healthcare Bill Now
All 1,000 pages plus. (This is the house version.)
UPDATE: You can read the CBO's preliminary analysis of this bill here. This is a 16 page pdf. They estimate that the federal deficit would increase by about 1 trillion over the period 2010 to 2019 due to this plan, noting:
The main provisions of the bill are due to take effect in 2013, so that is quite a price tag. Needless to say, the various revenue-raising schemes do not cover the costs. Beginning on page 9, there is a nice summary of the bill's main provisions according to the preliminary text provided to CBO. So far I haven't found major differences, but my mind is melting only a few hundred pages in. Pray for me as I hack my way through this jungle of fine words, airy promises, and a complete absence of engagement with reality. This thing really DOES remind me of Pick-A-Pay loans.
End Update.
There is a screamfest going on at Althouse's over it. Her comment:
I won't be back until I've finished it. Fortunately, I read quickly, although I suspect the comic aspects of this may slow me down. Also, I have to do some gardening. So I'll be reading, laughing, digging and planting.
I laughed myself silly over the summary, which sounds wonderful - people on Medicare get a lot more, people on Medicaid get a lot more, people get health insurance subsidies up to incomes of $88,000 - until you realize that everything is mandated for no additional cost except for actual treatment when someone gets something like cancer or a neurological disease. You won't have to pay for eyeglasses or to get your teeth cleaned, but my guess is that the truly ill will wind up getting a nice coffin at government-controlled prices.
Plus they've already figured out how much coverage is going to cost you. There is a board (which will probably be anonymous and meet under a mountain somewhere) who will figure out what coverage sick people will actually get, and I am guessing that it will be very little. Clearly someone has decided that sick people are the problem, and if we just don't bother to treat them, everything will be dandy! And we'll save a lot of money!
The theory that we will just decide how much we want to pay and get all the health care we want for that number has just a few tiny economic fallacies contained within it, but they will prove fatal. This appears to be a healthcare version of the Pick-A-Pay loans.
PS: Any time a government program is described as "nimble", you know we have left Realityburg and voyaged onward into LaLaLand. The appropriate background music for reading this thing is clearly "My Dingaling", and I offer a Youtube version that points up one of the advantages of this thing - because of all of the preventive medicine and wellness care, all those left alive will have the bodies of Greek gods and exude an jubilant joi-de-vive that must be seen to be imagined.
UPDATE: You can read the CBO's preliminary analysis of this bill here. This is a 16 page pdf. They estimate that the federal deficit would increase by about 1 trillion over the period 2010 to 2019 due to this plan, noting:
That estimate primarily reflects $438 billion in additional federal outlays for Medicaid and $773 billion in federal subsidies that would be provided to purchase coverage through the new insurance exchanges.Note that the attack on Medicare consists not of an explicit determination, but by the granting of other, extremely expensive, federal subsidies to other groups. That one trillion is going to be made up for not just with higher taxes but also by cutting benefits, and this bill can be seen as a strategy to create widespread support in the general population for depriving seniors of medical care.
The main provisions of the bill are due to take effect in 2013, so that is quite a price tag. Needless to say, the various revenue-raising schemes do not cover the costs. Beginning on page 9, there is a nice summary of the bill's main provisions according to the preliminary text provided to CBO. So far I haven't found major differences, but my mind is melting only a few hundred pages in. Pray for me as I hack my way through this jungle of fine words, airy promises, and a complete absence of engagement with reality. This thing really DOES remind me of Pick-A-Pay loans.
End Update.
There is a screamfest going on at Althouse's over it. Her comment:
Since I have been given no time to figure it out, I will ram through my explanation: They don't want us to see how terrible it is. My working theory must be it's a horror. Therefore, I am vehemently opposed to it. Aren't you?My first reaction exactly. They didn't read the stimulus, they didn't read the cap and trade and now I'm guessing no one's going to read this. It kind of takes the "representative" out of representative democracy, doesn't it?
I won't be back until I've finished it. Fortunately, I read quickly, although I suspect the comic aspects of this may slow me down. Also, I have to do some gardening. So I'll be reading, laughing, digging and planting.
I laughed myself silly over the summary, which sounds wonderful - people on Medicare get a lot more, people on Medicaid get a lot more, people get health insurance subsidies up to incomes of $88,000 - until you realize that everything is mandated for no additional cost except for actual treatment when someone gets something like cancer or a neurological disease. You won't have to pay for eyeglasses or to get your teeth cleaned, but my guess is that the truly ill will wind up getting a nice coffin at government-controlled prices.
Plus they've already figured out how much coverage is going to cost you. There is a board (which will probably be anonymous and meet under a mountain somewhere) who will figure out what coverage sick people will actually get, and I am guessing that it will be very little. Clearly someone has decided that sick people are the problem, and if we just don't bother to treat them, everything will be dandy! And we'll save a lot of money!
The theory that we will just decide how much we want to pay and get all the health care we want for that number has just a few tiny economic fallacies contained within it, but they will prove fatal. This appears to be a healthcare version of the Pick-A-Pay loans.
PS: Any time a government program is described as "nimble", you know we have left Realityburg and voyaged onward into LaLaLand. The appropriate background music for reading this thing is clearly "My Dingaling", and I offer a Youtube version that points up one of the advantages of this thing - because of all of the preventive medicine and wellness care, all those left alive will have the bodies of Greek gods and exude an jubilant joi-de-vive that must be seen to be imagined.
Weekly Claims Problems
The seasonal adjustments in weekly claims are always a bit iffy at certain points, and this is one of them.
The following are some numbers from the weekly claims from the last few years (which you can access here). The number in the first row in red is the NSA weekly initial claims, and the second number in blue is NSA continuing claims. The number in black between those two is the seasonal factor:
So the NSA claims for the week of 6/16/07 are 89% of the SA claims.
For 2009, the NSA figures (some of which are still preliminary) for the same period go:
6/13/2009 558,407/ 6,113,273
6/20/2009 568,552/ 6,078,496
6/27/2009 559,857/ 6,071,352
7/04/2009 581,145/ 6,135,066
7/11/2009 667,534/
We don't have the continuing claims number for this week because that is delayed a week. Seasonal factors are published ahead of the figures, and are as follows:
The Dept of Labor people who issue this report do a very fine job, and they note that a shift in the timing of auto layoffs might be distorting the relationship of SA and NSA claims and continuing claims. Bloomberg article:
So we could be seeing a knock-on effect from the depressed manufacturing areas. It's hard to know. It's also possible that the auto parts dealers followed the regular shutdown schedule. My impression based on some of the county data is that we are moving into the scorched-earth cycle for the more depressed areas in which small businesses start shedding employees or shutting down, and small retail mostly gives up the ghost.
I hope I'm wrong, but I have unemployment heading to around 11% in 2010.
There is another problem with seasonal adjustments in times of rapid economic change. Conceptually, closing of school systems or the closing of auto plants has a set effect on jobs related to the actual number of those jobs, and if claims are high from other layoffs, the Seasonal Factor (because it is expressed as a percent of the whole) may either under or over correct. This problem is kind of blatantly obvious in continuing claims this week, which are reported to have dropped 642,000, when in actuality they rose close to 64,000.
If you look at actual claims and continuing claims, there appears to be a flattening effect over the last six weeks. We may, however, be seeing a surge in ancillary service small business shutdowns in the most depressed areas, and if we are, we will see some very ugly numbers in August and September, although not necessarily in the weekly claims reports. The high number of contractor/individual proprietorships relative to corporate employment in those areas often distorts the claims reports versus unemployment surveys.
The following are some numbers from the weekly claims from the last few years (which you can access here). The number in the first row in red is the NSA weekly initial claims, and the second number in blue is NSA continuing claims. The number in black between those two is the seasonal factor:
| 06/16/2007 | 290,951 | 89.0 | 327,000 | 2,278,797 | 90.8 | 2,510,000 | 1.7 | 1.9 | 131,660,675 |
|---|---|---|---|---|---|---|---|---|---|
| 06/23/2007 | 292,583 | 91.9 | 318,000 | 2,353,893 | 91.3 | 2,578,000 | 1.8 | 2.0 | 131,660,675 |
| 06/30/2007 | 300,348 | 93.0 | 323,000 | 2,303,357 | 89.9 | 2,562,000 | 1.7 | 1.9 | 131,660,675 |
| 07/07/2007 | 417,554 | 131.4 | 318,000 | 2,581,098 | 99.3 | 2,599,000 | 2.0 | 2.0 | 132,170,980 |
| 07/14/2007 | 383,839 | 121.5 | 316,000 | 2,588,709 | 100.1 | 2,586,000 | 2.0 | 2.0 | 132,170,980 |
| 07/21/2007 | 298,366 | 95.7 | 312,000 | 2,463,232 | 96.4 | 2,555,000 | 1.9 | 1.9 | 132,170,980 |
| 07/28/2007 | 257,426 | 83.7 | 308,000 | 2,445,524 | 94.9 | 2,577,000 | 1.9 | 1.9 | 132,170,980 |
| 06/14/2008 | 349,255 | 89.6 | 390,000 | 2,852,599 | 90.6 | 3,149,000 | 2.1 | 2.4 | 133,382,559 |
|---|---|---|---|---|---|---|---|---|---|
| 06/21/2008 | 358,159 | 91.3 | 392,000 | 2,855,557 | 90.6 | 3,152,000 | 2.1 | 2.4 | 133,382,559 |
| 06/28/2008 | 368,544 | 91.0 | 405,000 | 2,857,438 | 88.8 | 3,218,000 | 2.1 | 2.4 | 133,382,559 |
| 07/05/2008 | 401,672 | 109.3 | 367,000 | 3,118,724 | 98.4 | 3,169,000 | 2.3 | 2.4 | 133,690,617 |
| 07/12/2008 | 483,981 | 125.2 | 387,000 | 3,164,970 | 100.0 | 3,165,000 | 2.4 | 2.4 | 133,690,617 |
| 07/19/2008 | 411,408 | 99.7 | 413,000 | 3,208,848 | 97.0 | 3,308,000 | 2.4 | 2.5 | 133,690,617 |
| 07/26/2008 | 376,123 | 85.1 | 442,000 | 3,166,763 | 94.7 | 3,344,000 | 2.4 | 2.5 | 133,690,617 |
For 2009, the NSA figures (some of which are still preliminary) for the same period go:
6/13/2009 558,407/ 6,113,273
6/20/2009 568,552/ 6,078,496
6/27/2009 559,857/ 6,071,352
7/04/2009 581,145/ 6,135,066
7/11/2009 667,534/
We don't have the continuing claims number for this week because that is delayed a week. Seasonal factors are published ahead of the figures, and are as follows:
| 06/13/2009 | 558,407 | 91.2 | 612,000 | 6,113,273 | 90.5 | 6,755,000 | 4.6 | 5.1 | 133,683,433 |
|---|---|---|---|---|---|---|---|---|---|
| 06/20/2009 | 568,552 | 90.3 | 630,000 | 6,078,496 | 90.4 | 6,724,000 | 4.5 | 5.0 | 133,683,433 |
| 06/27/2009 | 90.7 | 87.8 | |||||||
| 07/04/2009 | 102.2 | 97.8 | |||||||
| 07/11/2009 | 128.0 | 100.1 | |||||||
| 07/18/2009 | 104.8 | 97.8 | |||||||
| 07/25/2009 | 86.9 | 94.9 |
The Dept of Labor people who issue this report do a very fine job, and they note that a shift in the timing of auto layoffs might be distorting the relationship of SA and NSA claims and continuing claims. Bloomberg article:
Initial jobless claims dropped by 47,000 to 522,000, lower than forecast, in the week ended July 11, from a revised 569,000 the prior week, the Labor Department said today in Washington. The number of people collecting unemployment insurance plunged by a record 642,000, also reflecting seasonal issues surrounding the closures at carmakers.I am not sure that there is much of a distortion from the timing of the auto layoffs, because when I look at the shape of these curves they look somewhat comparable to prior years, and when I look at the states that showed early pops in July UI, they are the manufacturing states:
A Labor analyst said the distortions may play havoc with claims data for another couple of weeks. General Motors Co. and Chrysler Group LLC accelerated shutdowns this year heading into bankruptcy, months before the traditional July closings. Through the gyrations, job losses may subside amid signs the housing and manufacturing slumps are easing.
| State | Change | State Supplied Comment | |
| MN | +1,176 | No comment. | |
| KY | +1,203 | No comment. | |
| FL | +1,679 | Layoffs in the construction, trade, service, and manufacturing industries, and agriculture. | |
| IA | +3,351 | Increase due to temporary holiday layoffs. | |
| OH | +4,240 | Layoffs in the service and manufacturing industries. | |
| IN | +5,430 | Layoffs in the automobile, trade, service, and manufacturing industries. | |
| WI | +5,838 | Layoffs in the manufacturing industry. | |
| NY | +8,913 | Layoffs in the transportation and service industries. | |
| MI | +12,144 | Most industries posted increases. |
So we could be seeing a knock-on effect from the depressed manufacturing areas. It's hard to know. It's also possible that the auto parts dealers followed the regular shutdown schedule. My impression based on some of the county data is that we are moving into the scorched-earth cycle for the more depressed areas in which small businesses start shedding employees or shutting down, and small retail mostly gives up the ghost.
I hope I'm wrong, but I have unemployment heading to around 11% in 2010.
There is another problem with seasonal adjustments in times of rapid economic change. Conceptually, closing of school systems or the closing of auto plants has a set effect on jobs related to the actual number of those jobs, and if claims are high from other layoffs, the Seasonal Factor (because it is expressed as a percent of the whole) may either under or over correct. This problem is kind of blatantly obvious in continuing claims this week, which are reported to have dropped 642,000, when in actuality they rose close to 64,000.
If you look at actual claims and continuing claims, there appears to be a flattening effect over the last six weeks. We may, however, be seeing a surge in ancillary service small business shutdowns in the most depressed areas, and if we are, we will see some very ugly numbers in August and September, although not necessarily in the weekly claims reports. The high number of contractor/individual proprietorships relative to corporate employment in those areas often distorts the claims reports versus unemployment surveys.
Wednesday, July 15, 2009
Crude, Industrial Production & A Look At Ratios
Again no support for oil pricing - on a YoY basis this week's inventory report has gasoline inventories up 2.3% over last year's, and usage is almost the same as last year.
It appears that people drove less than expected over the weekend of the Fourth, because the four-week running total of gas supply dropped:
Inventories remain extremely high given the drop in usage to levels of a decade ago:
One thing that so startled me this week is that gasoline demand change YoY dropped from what it has been in the spring and early summer:
Industrial production also disappointed me. Today's report, covering June, gives US industrial production down 13.6% YoY. Utilities are down 3.9% over the year. Business equipment down 17.8%. Construction down 20.7%. Manufacturing down 15.5%. Capacity utilization dropped to 68.0%. Manufacturing capacity dropped to 64.6%. Yikes.
This St. Louis Fed graph doesn't include the latest month's figures, but it shows how unprecedented the drop has been:
June rail traffic was something of an improvement over the spring, but it was not an improvement over YTD figures, which is significant. If we were to enter any type of recovery, we should see YoY drops less than the YTD YoY drops:
One factor that really struck me in the June US retail report was that the weakness I had noticed in the drugstore traffic and pricing seemed to be showing up in the figures. On an SA basis 446 trends:
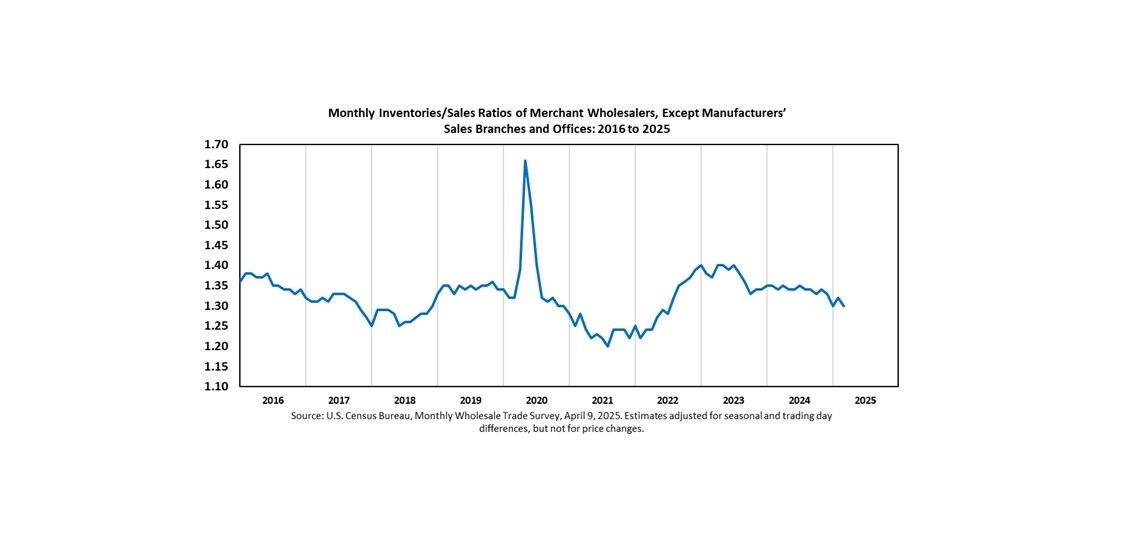
Because sales are so low, inventory liquidation is struggling to keep up:

We would seem to have a long way left to go. 1.35 is probably the magic number at which we can look for overall resupply needs beginning to exceed inventory clearing needs. At the wholesale level, the number we are looking for is 1.20:
Given the almost unbelievably low capacity utilization figures, I think construction spending is due to drop below 800 before stabilizing:

So I certainly can't project an increase in oil usage any time soon.
It appears that people drove less than expected over the weekend of the Fourth, because the four-week running total of gas supply dropped:
Total products supplied over the last four-week period has averaged about 18.4 million barrels per day, down by 6.1 percent compared to the similar period last year. Over the last four weeks, motor gasoline demand has averaged 9.1 million barrels per day, up by 0.6 percent from the same period last year. Distillate fuel demand has averaged about 3.3 million barrels per day over the last four weeks, down by 11.7 percent from the same period last year. Jet fuel demand is 12.3 percent lower over the last four weeks compared to the same four-week period last year.On a YTD YoY basis, product supply for domestic use has now dropped to -6.4%, and total net imports have dropped to -7.5%. I am a little startled by these figures. I had expected them to go the other way. It kind of looks to me like we are heading to crude prices around the $50 level, but there may not be a floor there, even with strong spec buying. Average import prices on the last month's report were $51 a barrel. We're going back lower than that.
Inventories remain extremely high given the drop in usage to levels of a decade ago:
U.S. commercial crude oil inventories (excluding those in the Strategic Petroleum Reserve) decreased by 2.8 million barrels from the previous week. At 344.5 million barrels, U.S. crude oil inventories are above the upper boundary of the average range for this time of year. Total motor gasoline inventories increased by 1.5 million barrels last week, and are in the upper half of the average range. Finished gasoline inventories fell last week while gasoline blending components increased during this same time. Distillate fuel inventories increased by 0.6 million barrels, and are above the upper boundary of the average range for this time of year. Propane/propylene inventories increased by 2.3 million barrels last week and are above the upper limit of the average range. Total commercial petroleum inventories increased by 1.5 million barrels last week, and are above the upper limit of the average range for this time of year.See the previous post discussing the BP Statistical Review. At that time YTD YoY net imports were down 5.8%. In this report they are listed as being down 7.5%. Believe me, this says nothing favorable for oil price expectations. Last year, US oil consumption dropped 6.4%. With just over half the year gone, we are exactly in line with that trend, suggesting about a 3-4% world demand drop. (I do not believe that every other country is maintaining demand! However, if you do, we are still looking at a US-induced two-year swing of -2.5% at least.)
One thing that so startled me this week is that gasoline demand change YoY dropped from what it has been in the spring and early summer:
Over the last four weeks, motor gasoline demand has averaged 9.1 million barrels per day, up by 0.6 percent from the same period last year.Last week it was up by 0.9 percent. I think this may be due to lower holiday usage. If not, it says something extraordinarily negative about the trajectory of the US economy over the rest of the year.
Industrial production also disappointed me. Today's report, covering June, gives US industrial production down 13.6% YoY. Utilities are down 3.9% over the year. Business equipment down 17.8%. Construction down 20.7%. Manufacturing down 15.5%. Capacity utilization dropped to 68.0%. Manufacturing capacity dropped to 64.6%. Yikes.
This St. Louis Fed graph doesn't include the latest month's figures, but it shows how unprecedented the drop has been:
June rail traffic was something of an improvement over the spring, but it was not an improvement over YTD figures, which is significant. If we were to enter any type of recovery, we should see YoY drops less than the YTD YoY drops:
The Association of American Railroads today reported that U.S. railroads originated 1,039,889 carloads of freight in June 2009, down 19.7 percent with 255,668 fewer carloads, compared with June 2008. U.S. intermodal rail traffic – comprising trailers and containers on flat cars that are not included in carload figures – totaled 755,000 units in June 2009, down 18.2 percent compared with the same period last year with 168,031 fewer trailers and containers.My expectations were modest, but were not met.
For the first six months of 2009, total U.S. rail carloadings were down 19.5 percent (1,594,411 carloads) to 6,579,294 carloads, while intermodal traffic was down 17.0 percent (950,147 units) to 4,647,068 trailers and containers.
One factor that really struck me in the June US retail report was that the weakness I had noticed in the drugstore traffic and pricing seemed to be showing up in the figures. On an SA basis 446 trends:
April: 21,05144611 (pharmacy & drugs) figures for June are not available yet, but sales dropped from 17,538 to 17,475 from April to May.
May: 21,036
June: 20,969
Because sales are so low, inventory liquidation is struggling to keep up:
We would seem to have a long way left to go. 1.35 is probably the magic number at which we can look for overall resupply needs beginning to exceed inventory clearing needs. At the wholesale level, the number we are looking for is 1.20:
Given the almost unbelievably low capacity utilization figures, I think construction spending is due to drop below 800 before stabilizing:
So I certainly can't project an increase in oil usage any time soon.
Tuesday, July 14, 2009
Reading, Reading, Reading
Sorry for the quietness, but I am plowing through a bunch of reports.
In particular, readers might find this Fitch report on recoveries in corporate defaults interesting. It certainly relates to the topic of the prior post. It covers both bonds and loans. You probably have to register to get this pdf.
See, for example, the graph on page 3 which gives current loan recovery rates of 57.5%. That is already 10% below the low of the previous recession, which occurred in 2002. I would expect this to get worse rather than better, and it points up the problem with credit and monetary policy. One can't stimulate with credit when the cash flow to service the loans and keep the company running isn't there, and current economic activity levels are low enough to annihilate debt-loaded companies.
I thought you guys and gals would enjoy this quote, because it made me laugh out loud, which has not occurred for me since I last read a Chinese corporate report (those things are often hysterically funny):
Anyway, given the current situation, there is not a great deal of badda-bing coming from corporates or small businesses in the months ahead. The losses are just beginning to roll in - generally your maximum credit losses occur a couple of years after the onset of a recession. Maximum credit losses appear to be scheduled to be worse than in the prior recession due to loose lending, and lenders who have indulged in non-underwritten lending are gonna get it in the chops.
Before we all bail out another company, perhaps we should all sit down and contemplate the effective restraints existing in the economy.
In particular, readers might find this Fitch report on recoveries in corporate defaults interesting. It certainly relates to the topic of the prior post. It covers both bonds and loans. You probably have to register to get this pdf.
See, for example, the graph on page 3 which gives current loan recovery rates of 57.5%. That is already 10% below the low of the previous recession, which occurred in 2002. I would expect this to get worse rather than better, and it points up the problem with credit and monetary policy. One can't stimulate with credit when the cash flow to service the loans and keep the company running isn't there, and current economic activity levels are low enough to annihilate debt-loaded companies.
I thought you guys and gals would enjoy this quote, because it made me laugh out loud, which has not occurred for me since I last read a Chinese corporate report (those things are often hysterically funny):
Fitch found that in the period covered by the study, companies with the weakest emergence firm values entered bankruptcy with relatively little bank debt, suggesting that some mechanism, perhaps covenants, allowed senior secured lenders to reduce or avoid exposure to weak credits prior to bankruptcy. However, diminished debt cushions and a pronounced erosion in traditional loan covenants - two trends that accompanied the leveraged loan issuance boom of 2005−2007, are proving to be detrimental to loan recovery rates in this downturn. The average 30-day post-default recovery rate on loans in Fitch’s U.S. High Yield Default Index was just 57.5% in the first five months of 2009, the lowest tally recorded by Fitch in a decade, as shown in the chart above. Changes in underwriting standards can have a very meaningful impact on recovery outcomes.Well, who'd a thunk? Underwriting reduces losses and loan covenants to stop the flow of money when the underlying credit quality has worsened protect lenders? Where is Gomer Pyle to say "gaaaawlly" when you need him? Believe it or not, Fitch appears to find some sort of revelatory significance in this finding, returning to it later on page 10 with:
Nonetheless, additional findings surrounding secured debt and in particular, senior secured loans (discussed below) suggest that mechanisms were in place that allowed senior secured lenders to avoid the worst bankruptcy situations.Imitating old Gomer was no longer sufficient to express my feelings, and a loud ejaculation of "No shit, Sherlock" escaped my unladylike lips. On page 11, I collapsed into awed silence at the news that companies with the lowest after-bankruptcy valuations had the lowest ratios of senior secured debt to all debt and that gravity makes objects released from restraint fall toward the largest mass in the area. The data in the report is interesting (see the table on page 17 by industry), but the conclusions are kind of on the Fred Flintstone level.
Anyway, given the current situation, there is not a great deal of badda-bing coming from corporates or small businesses in the months ahead. The losses are just beginning to roll in - generally your maximum credit losses occur a couple of years after the onset of a recession. Maximum credit losses appear to be scheduled to be worse than in the prior recession due to loose lending, and lenders who have indulged in non-underwritten lending are gonna get it in the chops.
Before we all bail out another company, perhaps we should all sit down and contemplate the effective restraints existing in the economy.
Monday, July 13, 2009
Time To Revisit Commercial Credit
First, here's the current release and graph:
Note the amazing collapse in nonfinancial (blue cliff). This always happens in recessions, but the trajectory in this one is amazingly steep. And notice when the cliff diving began - in 2009. As oil fell out and companies ramped back production, the need for credit decreased. The difference in 2001 was that asset backed did not collapse and the decline in credit was slow.
CIT Group is trying to claim that it is too big to fail:
Out of fairness, you should read CIT Group's own press releases which are available here. The short history is that CIT Group, along with GS and other NBFI Wall Street ruffians, applied for bank holding company status during the crisis. So there is now an entity known as CIT Bank. One of the things CIT Group wants is for the FDIC to let it dump its bad debt into the bank. So far, FDIC has been mostly holding the line on CIT Group, although it did approve the CIT OnlineBank app, the primary purpose of which was to get hot money.
CIT is very active in retail and small business lending, but over the last year it has become less so, largely due to not having money. And every time you read an article like this, replete with examples of business owners bewailing the loss or threatened loss of their financing, you have to realize that one of the reasons CIT is in such trouble is because it was a "generous" lender. Its home loans and student loans went bad, and then just about everything else followed. Over a year ago, in June of 2008, Goldman Sachs stepped up to the plate with 3 billion in financing. I want to stress that GS is now saying that it has no material exposure to CIT Group.
CIT Group was kind of the king of the commercial paper markets over recent years, just a massive money mill. You're talking everything from lines of consumer financing for companies like Dell to student loans, manufacturing, etc. It was really cranking on the equipment leasing/financing for a while there.
This slide presentation (8-K exhibit 99.1 Sept 11, 2007) given at the Lehman conference is at least historically interesting, especially the claim that its performance would improve as the economy got weaker. At that time, its portfolio consisted of the following:

Click on this baby for a larger version. You can kind of tell what happened. After this CIT tried to do more with some transport deals, etc, and we all know how that sector is holding up.
As for being "too big to fail", I don't think it is. Smaller corporations will probably pick up the better credit prospects. One of the problems has been a dearth of good lending prospects, and there is quite a bit of money sitting out there in bank deposits.
I am sure that some commercial and retail credit will be yanked, but it is not clear to me that this is preventable. If the losses are there, they are there. We're past the plausible deniability border on a lot of businesses, and they will either be forced to contract enough to make a profit, or will go out of business. Those dying strip malls around the country have a lot to do with CIT Group's problems, but baby, they aren't coming back.
The reason for this post is that I have been claiming that the recession's intense phase was caused not by a credit contraction, but by high fuel prices, degenerating margins and defaulting credit. However, I do believe that access to credit could become more of a problem for the economy as we try to grow out of this slump. Small businesses, in my view, are not mostly currently in trouble due to no credit for ongoing business, but speculative credit for many small businesses (we'll be all right if you just lend us enough to get us through another six months) is going to be hard to find unless you can present contracts or have maintained bread and butter lines of business. The concern is that some businesses will have a hard time finding credit as banks are struggling to cover their losses on their loan portfolios.
This is why I foresee a double dip. I can model changes in the shape of the curve (as in my famous fried egg post which baffled everyone), but not that it must happen. This administration got its causation wrong, and has been treating the patient for the wrong disease. We have got to increase velocity, and the only way to do that is to launch a massive program of infrastructure investment, which was grossly neglected in the original stimulus bill. It is far more important to create private sector activity and jobs than to create government jobs, which was really what the stimulus bill was all about.
What you are looking at in that commercial credit graph at the top of this post is absolutely not a recovery. We can get a shorter pop, but the credit isn't in bank portfolios (see H.8) and it is not on the market. There is no recovery without credit expansion in businesses. This thing has just lasted too long and has exhausted reserves on a lot of businesses, and as unemployment continues to rise, default ratios and chargeoffs on just about all asset types are doomed to keep rising. It is quite insane to expect the household sector with its massive debt loads to prime the pump.
The moves to control compensation and otherwise meddle with banks have created a situation in which the Fed's efforts to infuse money into the banking system to prevent credit from becoming a drag on functional businesses was busted by the political posturing of Congress Critters.
If you look at commercial credit, we appear to be taking a nice ride in the Titanic.
Note the amazing collapse in nonfinancial (blue cliff). This always happens in recessions, but the trajectory in this one is amazingly steep. And notice when the cliff diving began - in 2009. As oil fell out and companies ramped back production, the need for credit decreased. The difference in 2001 was that asset backed did not collapse and the decline in credit was slow.
CIT Group is trying to claim that it is too big to fail:
A collapse would ripple across the “small and medium-sized businesses who rely on CIT to operate -- to pay their vendors, ship goods to their customers and make their payroll,” the New York-based lender said in internal documents obtained by Bloomberg News that make the case for its importance to the U.S. economy. CIT spokesman Curt Ritter declined to comment on the documents. CIT executives spoke with regulators during the past two days, according to a person familiar with the talks, after its bonds and shares tumbled on concern that the Federal Deposit Insurance Corp. won’t allow the lender into its bond-guarantee program created last year to unfreeze debt markets. CIT may default as soon as April, when a $2.1 billion credit line matures, according to Fitch Ratings.Their theory is that if they collapse, their funding to businesses would not be replaced by other sources.
Out of fairness, you should read CIT Group's own press releases which are available here. The short history is that CIT Group, along with GS and other NBFI Wall Street ruffians, applied for bank holding company status during the crisis. So there is now an entity known as CIT Bank. One of the things CIT Group wants is for the FDIC to let it dump its bad debt into the bank. So far, FDIC has been mostly holding the line on CIT Group, although it did approve the CIT OnlineBank app, the primary purpose of which was to get hot money.
CIT is very active in retail and small business lending, but over the last year it has become less so, largely due to not having money. And every time you read an article like this, replete with examples of business owners bewailing the loss or threatened loss of their financing, you have to realize that one of the reasons CIT is in such trouble is because it was a "generous" lender. Its home loans and student loans went bad, and then just about everything else followed. Over a year ago, in June of 2008, Goldman Sachs stepped up to the plate with 3 billion in financing. I want to stress that GS is now saying that it has no material exposure to CIT Group.
CIT Group was kind of the king of the commercial paper markets over recent years, just a massive money mill. You're talking everything from lines of consumer financing for companies like Dell to student loans, manufacturing, etc. It was really cranking on the equipment leasing/financing for a while there.
This slide presentation (8-K exhibit 99.1 Sept 11, 2007) given at the Lehman conference is at least historically interesting, especially the claim that its performance would improve as the economy got weaker. At that time, its portfolio consisted of the following:

Click on this baby for a larger version. You can kind of tell what happened. After this CIT tried to do more with some transport deals, etc, and we all know how that sector is holding up.
As for being "too big to fail", I don't think it is. Smaller corporations will probably pick up the better credit prospects. One of the problems has been a dearth of good lending prospects, and there is quite a bit of money sitting out there in bank deposits.
I am sure that some commercial and retail credit will be yanked, but it is not clear to me that this is preventable. If the losses are there, they are there. We're past the plausible deniability border on a lot of businesses, and they will either be forced to contract enough to make a profit, or will go out of business. Those dying strip malls around the country have a lot to do with CIT Group's problems, but baby, they aren't coming back.
The reason for this post is that I have been claiming that the recession's intense phase was caused not by a credit contraction, but by high fuel prices, degenerating margins and defaulting credit. However, I do believe that access to credit could become more of a problem for the economy as we try to grow out of this slump. Small businesses, in my view, are not mostly currently in trouble due to no credit for ongoing business, but speculative credit for many small businesses (we'll be all right if you just lend us enough to get us through another six months) is going to be hard to find unless you can present contracts or have maintained bread and butter lines of business. The concern is that some businesses will have a hard time finding credit as banks are struggling to cover their losses on their loan portfolios.
This is why I foresee a double dip. I can model changes in the shape of the curve (as in my famous fried egg post which baffled everyone), but not that it must happen. This administration got its causation wrong, and has been treating the patient for the wrong disease. We have got to increase velocity, and the only way to do that is to launch a massive program of infrastructure investment, which was grossly neglected in the original stimulus bill. It is far more important to create private sector activity and jobs than to create government jobs, which was really what the stimulus bill was all about.
What you are looking at in that commercial credit graph at the top of this post is absolutely not a recovery. We can get a shorter pop, but the credit isn't in bank portfolios (see H.8) and it is not on the market. There is no recovery without credit expansion in businesses. This thing has just lasted too long and has exhausted reserves on a lot of businesses, and as unemployment continues to rise, default ratios and chargeoffs on just about all asset types are doomed to keep rising. It is quite insane to expect the household sector with its massive debt loads to prime the pump.
The moves to control compensation and otherwise meddle with banks have created a situation in which the Fed's efforts to infuse money into the banking system to prevent credit from becoming a drag on functional businesses was busted by the political posturing of Congress Critters.
If you look at commercial credit, we appear to be taking a nice ride in the Titanic.
Gave Me Pause
Bloomberg article on Fitch rating action on Japanese CMBS. I'll have to stagger off to Fitch and see what's really going on, but it sounds as if Fitch is now assuming that all balloon-backed Japanese CMBS will default over the next year, because over the last six months the majority of them have:
Default rates on loans underlying Japanese commercial mortgage-backed securities rose to an “unprecedented high” of 53 percent in the first half, Fitch Ratings said.The crash that just keeps crashing....
...
“The agency expects the extremely challenging refinancing environment to continue,” Fitch said in today’s statement. “The lack of finance and the resultant forced disposition of assets are weighing heavily on the real estate market.”
Friday, July 10, 2009
A Second Failure In Chinese Bond Sales
Chinese exports dropped again (although slightly higher than May), but the big news is that a Chinese bond sale failed again:
The Ministry of Finance sold 25.1 billion yuan ($3.7 billion) in bills of the 35 billion yuan it had sought, according to statements on the Web site of Chinabond, the nation’s biggest debt-clearing house. The government fell short of its target in a bond sale for the first time in almost six years on July 8.First, there are already stock and housing bubbles. It seems to me that everyone's still happily playing in those sandboxes.
Wednesday, July 08, 2009
Crude Inventories
See today's prior post on China and commodities below.
Here. The bottom line is that supplies of finished motor gasoline are up over last year, the supply of diesel moved up slightly, and the four week running average of imports is 775,000 barrels below last year's.
Crude inventories are 17.8% above last year's levels. Total stocks ex SPR are up 13.7% above last year's levels. YTD YoY comparisons of total product supplied for domestic use are down 5.9%. Motor gasoline demand for the last four weeks is now up 1.3% over last year. This supports the idea that some employment is popping up somewhere, perhaps in temp jobs. We'll see how this carries through the summer. The four week running average of distillate demand is now down 12.3% from last year.
From the narrative:
...U.S. crude oil inventories are above the upper boundary of the average range for this time of year. Total motor gasoline inventories increased by 1.9 million barrels last week, and are in the upper half of the average range. Both finished gasoline inventories and gasoline blending components increased last week. Distillate fuel inventories increased by 3.7 million barrels, and are above the upper boundary of the average range for this time of year. Propane/propylene inventories increased by 1.3 million barrels last week and are above the upper limit of the average range. Total commercialThere is certainly no support for oil prices in this report. Gas prices have peaked and are dropping:
petroleum inventories increased by 5.1 million barrels last week, and are above the upper limit of the average range for this time of year.
China And Commodities
A Chinese debt auction fell short:
It's unlikely that exports will rebound halfway over the next year, so that leaves China with some technical problems. So far China has followed the course I expected - stocking up on commodities and stoking their internal fires. I am expecting them to start slowly pushing the yuan down in an attempt to support exports - they have already done most of what they can do in the way of cutting taxes on exports and so forth. I also expect their metals buying to be mostly lower.
Both China and India raises energy prices over the last few weeks. Chinese electricity production may be rebounding a bit, but there is still no pattern of YoY growth. Therefore I have trouble believing that the economy is growing substantially. After Zhao Bingren's comments, the issue appears now to be sensitive and perhaps somewhat censored. May US YoY electricity consumption was down 3.4%. May Chinese YoY electricity consumption was down 3.5%. Go figure.
We now enter an interesting period in which everyone has to try to keep in the middle of the monetary policy road while stimulating growth. It is going to be an exercise in inspired discretion at central banks, or perhaps aspirational recklessness at some. Only history will sort the efforts of the various central banks correctly.
Germany reported a hefty May increase in industrial production. This is unequivocally good news, but it must be tempered against the reality of very substantial overcapacity in the face of massive YoY drops. (Compare to US industrial production.) Japan, in contrast, is showing continued and in some aspects growing weakness, as in machinery orders and lower exports. The problem for Japan is that global and industrial overcapacity in industrial production is cutting industrial investment. It is not very likely that this trend will reverse itself any time soon. What happens if world industrial production resets itself about 8-10% lower over the next 12 months than in 2007?
It appears to me that we are close to the limits of monetary policy on a global scale. This discussion of dynamics in the Australian economy illustrates the world conundrum. Economies have a certain capacity to absorb debt. If one continues to crank up the money supply after that level has been reached, the result will be bubbles or inflation, both of which result in eventual contractions rather than sustainable growth. Our current global situation fails the dynamics of widespread inflation, because the incomes and/or the spending desire in the consumer segment is flagging. Thus, cranking up the money spigot too widely will tend to produce bubbles.
This afternoon the US consumer credit report comes out. The June Redbook retail report showed very constrained spending, and I don't see anything about US dynamics changing in the near future.
Against this, we now see renewed interest in commodity trading regulations, because there is no doubt that energy trading has been highly speculative over the last few years. I suspect that the focus on regulatory changes will have more of an effect on trading patterns than the hard statistics, but neither are favorable.
Heating oil contracts I've checked in the MidAltantic region seem to be ranging under $2.30, and spot prices for sizeable orders are as much as 20 cents lower. There's a considerable discrepancy between futures trading and end user sales prices.
I also noted with great interest that India is slapping a hefty import tax increase on gold and silver imports. Rural Indian consumer inflation is still running very high, which is also suggestive of a peak in credit formation.,
China failed to complete a 28 billion yuan ($4.1 billion) government bond sale for the first time, as the central bank withdrew cash from the financial system to reduce inflation pressures.The bottom line is that Chinese bank lending is still soaring, and it appears that a decent amount of the credit has gone into corresponding housing/stock bubbles. See this Forbes article on housing market measures, changes to mortgage lending, etc. The regulators are worried with reason. Requiring the higher downpayments on second homes is a thoughtful response. However, the nastiest thing about China's situation is that housing sales are highly correlated with stock gains. China has a high savings rate, but a poor banking system, so a great deal of savings goes directly into the stock market.
The Ministry of Finance sold 27.5 billion yuan of one-year notes at a yield of 1.06 percent, compared with 0.89 percent at the last auction of similar-maturity debt in May, according to Chinabond, the nation’s biggest debt-clearing house. Later, the People’s Bank of China it said will resume the sale of one-year bills tomorrow after an eight-month suspension.
It's unlikely that exports will rebound halfway over the next year, so that leaves China with some technical problems. So far China has followed the course I expected - stocking up on commodities and stoking their internal fires. I am expecting them to start slowly pushing the yuan down in an attempt to support exports - they have already done most of what they can do in the way of cutting taxes on exports and so forth. I also expect their metals buying to be mostly lower.
Both China and India raises energy prices over the last few weeks. Chinese electricity production may be rebounding a bit, but there is still no pattern of YoY growth. Therefore I have trouble believing that the economy is growing substantially. After Zhao Bingren's comments, the issue appears now to be sensitive and perhaps somewhat censored. May US YoY electricity consumption was down 3.4%. May Chinese YoY electricity consumption was down 3.5%. Go figure.
We now enter an interesting period in which everyone has to try to keep in the middle of the monetary policy road while stimulating growth. It is going to be an exercise in inspired discretion at central banks, or perhaps aspirational recklessness at some. Only history will sort the efforts of the various central banks correctly.
Germany reported a hefty May increase in industrial production. This is unequivocally good news, but it must be tempered against the reality of very substantial overcapacity in the face of massive YoY drops. (Compare to US industrial production.) Japan, in contrast, is showing continued and in some aspects growing weakness, as in machinery orders and lower exports. The problem for Japan is that global and industrial overcapacity in industrial production is cutting industrial investment. It is not very likely that this trend will reverse itself any time soon. What happens if world industrial production resets itself about 8-10% lower over the next 12 months than in 2007?
It appears to me that we are close to the limits of monetary policy on a global scale. This discussion of dynamics in the Australian economy illustrates the world conundrum. Economies have a certain capacity to absorb debt. If one continues to crank up the money supply after that level has been reached, the result will be bubbles or inflation, both of which result in eventual contractions rather than sustainable growth. Our current global situation fails the dynamics of widespread inflation, because the incomes and/or the spending desire in the consumer segment is flagging. Thus, cranking up the money spigot too widely will tend to produce bubbles.
This afternoon the US consumer credit report comes out. The June Redbook retail report showed very constrained spending, and I don't see anything about US dynamics changing in the near future.
Against this, we now see renewed interest in commodity trading regulations, because there is no doubt that energy trading has been highly speculative over the last few years. I suspect that the focus on regulatory changes will have more of an effect on trading patterns than the hard statistics, but neither are favorable.
Heating oil contracts I've checked in the MidAltantic region seem to be ranging under $2.30, and spot prices for sizeable orders are as much as 20 cents lower. There's a considerable discrepancy between futures trading and end user sales prices.
I also noted with great interest that India is slapping a hefty import tax increase on gold and silver imports. Rural Indian consumer inflation is still running very high, which is also suggestive of a peak in credit formation.,
Saturday, July 04, 2009
Independence Day 09!
Enjoy it.
Independence Day 1776 brought a democratic Constitution to Japan and Germany, so I think they ought to be celebrating too. (It's not that I didn't write that to be a bit obnoxious, but I also believe it. The meaning of Independence Day)
Sometimes I think some of our elected representatives need to be reminded of the meaning of day themselves, because when voters voting against you is considered terrorism, taxation without representation is the legislative goal! I'm considering mailing Karen Bass a teabag and a copy of the Declaration of Independence, as well as a sincere note thanking her for the laugh. For some reason teabags really upset some folks.
Ah, fireworks!
Friday, July 03, 2009
Bike Messengers And Oil
The impact of unregulated futures exchanges can be intuitively seen in this story:
If everyone knows who is doing what, murky movements on the exchanges can be rebutted (for a profit) by more knowledgeable traders. Commodities exchanges overall reduce the price of commodities because they tend to forecast supply/demand changes and signal producers to adjust earlier. That is to the good. But really murky thin trading can cause rampant speculation. See this June 08 article discussing some of the problems with ICE.
In our current situation, in which returns on bonds are very low and currency risks are very high, commodity speculation is likely to be used as a hedge. That is okay only to the point at which has not yet divorced from the fundamentals of physical contracts.
The startling spike in oil prices to their highest level this year on Tuesday was caused by a rogue broker who placed a massive bet in the Brent oil market, triggering almost $10m (€7m) of losses for his company.No matter how stupid a big trading move, you can usually get a decent number of people to follow. If there are a couple of stories out there about oil going to $200 a barrel, the atmosphere is favorable. This time it wasn't, since a bunch of reports had just been issued suggesting otherwise (i.e. summer price peak of gasoline already here, high supplies, world demand not to reach previous peak for years).
...
Oil traders in London and New York said the “unauthorised trading” explained the exceptional spike in business activity and prices in the early hours of Tuesday that some initially thought must have been caused by a geopolitical event.
...
Traders said the broker implicated had allegedly accounted for at least half of the unusual activity, with the rest the result of others chasing the rally.
If everyone knows who is doing what, murky movements on the exchanges can be rebutted (for a profit) by more knowledgeable traders. Commodities exchanges overall reduce the price of commodities because they tend to forecast supply/demand changes and signal producers to adjust earlier. That is to the good. But really murky thin trading can cause rampant speculation. See this June 08 article discussing some of the problems with ICE.
In our current situation, in which returns on bonds are very low and currency risks are very high, commodity speculation is likely to be used as a hedge. That is okay only to the point at which has not yet divorced from the fundamentals of physical contracts.
![]()
