 MaxedOutMama
Wednesday, February 29, 2012
Welcome To Appalachamerica
We didn't fall into a recession - we fell into a depression.
Look at Table 3. Net real dollar increase in Q4 GDP was 98.3. The swing in private inventories (counted as a plus in GDP, but inventory builds are generally a minus for future periods) alone from Q3 to Q4 was 96.4. Okay? There was no real growth in Q4.
Worse yet, while we did get this pickup in production activity (because of earlier inventory draws), look at the consumption figures. Food at home fell 2.4 billion. Gas fell 2.5 billion. Housing and utilities fell 11.4 billion Insurance fell 2.2 billion.
A whole chunk of people have fallen right through the poverty floor. Look at the nondurable goods portion of PCE. Over the last two quarters of 2011:
- Real spending on food dropped 2.6 billion.
- Clothing and footwear dropped 4.4 billion.
- Gas & fuel dropped 3.5 billion.
Tuesday, February 28, 2012
Durables Somewhat Perturbing
What bothers me about this report is the implication that inventories are beginning to pile up. Still, it may be okay - but this is the report to watch for the next few months. It looks like we are close to the edge in transportation, and that definitely needs watching. Both the monthly drop in new orders (-4.0%) and the monthly build in inventories (+0.7%) are large for this report. Then you look at the rail figures and start to wonder....
Inventories had reached the sensitive point, but seemed to have been correcting by themselves. They are high enough that one must be alert to relatively small changes in final demand. This graph only goes through December!!!

The relatively big drop in both shipments and new orders for primary metals is not the most favorable sign.
The seasonally-adjusted inventories graph looked a bit rougher all along:

When the final January numbers are out, these graphs will look worse. The international decline in growth trajectory does not help US manufacturers.
US real disposable per capita incomes (after-tax) are not going the right way, so there's a potential issue here - US demand is not likely to take up any international slack:

Utility figures don't lie!

Industrial production for non-durable consumer goods has followed real disposable per-capita incomes much more closely:

My entire skipping recession rests on the theory that we won't have a cosmic alignment; right now that theory looks a tad questionable. You have to think gas prices push most consumers closer to the edge even with easy money.
We know the easy-money thang will continue, so....
The only really favorable thing I can hang my hat on are bank deposits, because they are growing again. But looking at small domestic charters makes me dubious:

You have to open this up and look at it. The unified deposits/loans and leases spike is almost certainly draws on credit lines putting cash in bank deposits to cover tax bills.
Overall it appears that people finally caught up with themselves on the credit/cash ratios, but now we wait to see what happens. Falling incomes and higher expenses tend to increase conservative behaviors.
A lot of the fall in loans was write-offs, so don't get too exuberant. The epic gap between funding deposits and floated credit has finally shifted positively and should be considered a resilience factor right now for the US economy.
You can see some of the spike in All Domestic Banks (here we are using total deposits because other deposits wasn't reported until recently):

If you open this up you can see a bit of the spike in loans, but the spike in deposits is obvious.
Deposits tend to rise relatively rapidly before a recession, so this is not necessarily good news.
Friday, February 24, 2012
Flying Like A Lead Balloon
Before reading further, you might want to check out the latest installment in Shrinkwrapped's series on his father's WWII experiences. The reading's a bit harrowing, but it might predispose you to look on the bright side regarding our current situation.
USA fundamentals, despite favorable YoY conditions, are just not green-shooting. It looks more like somebody sprayed the landscape with Agent Orange, and this concerns me, because most of the negative impact from the Euro money throw and the Fed's next desperate move (hurling money from Mars to Venusians?) have yet to take root. But take root they will, so. ...
The basics: New Home Sales for January are really flat as a pancake YoY. Look at the NSA YoYs. There is more activity in construction, but a lot of it seems to be in the remodeling. Remember, all those foreclosures are rolling out the door and a lot of cash is going into buying, fixing up and in some cases renting. The bright side is that inventory is down. The dark side is that new sales activity edges ever lower price-wise. In part this may be because real sales increased seem to be confined to the south, and maybe the midwest later in the year. Naturally this would push prices down.
You can safely ignore the month over month and even the SA YoY data; the 90% confidence intervals exceed the reported changes so hugely that one can only laugh at them. Reporting these numbers is an exercise in futility, so I won't. There has been a big improvement in months' supply over the course of the year - we are now down to 6.7 NSA, which is good enough. We have reached bottom on this indicator for this cycle; whether we see much of a pickup through 2012 depends on numerous factors - mostly retirement activity and existing home sales. So don't expect fireworks. However since the new home sales/construction seems to have reached its natural low, refurbishing activity on residences should generate a net economic plus through most of this year.
Now, back to basics. As I previously discussed, utility production in the US is on a negative trend, and so far that situation shows not a trace of improving, and furthermore the duration of the trend is so long that it looks like it occurred in a recession.
Rail is now showing almost no YoY growth. Here you might want to start worrying. because seven weeks in rail data should be showing a positive weather-related YoY bias. Perhaps it does, but with carloads up YoY a meager 0.3%??? and intermodal up YoY a Hail-Mary 2.2%, one does not like to think this way. On rail, the period from March-May should have a very positive upward bias in 2012 compared to the same period in 2013. Or so I have marked on my exception charts due to the impact of Japanese supply-line disturbances last year. We can only wait prayerfully to see.
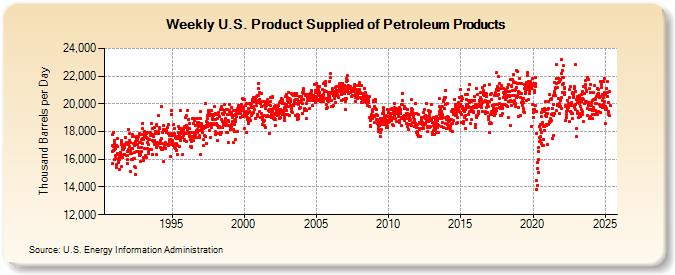
Oil:
Total products supplied over the last four-week period have averaged about 18.1 million barrels per day, down by 6.7 percent compared to the similar period last year. Over the last four weeks, motor gasoline product supplied has averaged 8.2 million barrels per day, down by 6.1 percent from the same period last year. Distillate fuel product supplied has averaged about 3.6 million barrels per day over the last four weeks, down by 5.9 percent from the same period last year. Jet fuel product supplied is 9.1 percent lower over the last four weeks compared to the same four-week period last year.This is all the more striking, because if you look back at the rail data you see the big pop in oil shipments. We really are exporting a lot more product, but domestic consumption is dropping faster - the export production should be boosting domestic consumption somewhat. YTD YoY domestic consumption is down 5.4%, so this is not one of these statistical artifacts.
Auto production is still cranking along, but I'm wondering if inventory isn't going to get out ahead of itself a few months down the line. I'm starting to hear ads on the radio with "no-payments-for" deals; usually this is a six-month warning for problems. Because of very high deposit-to-loan ratios at US banks, we are in an easy-money environment.
We are going to get absolutely no help from externals. China is in a sag and I don't think measures to boost it very much can work without raising inflation to intolerable levels, because it is coming down so hard that you have to hurl a huge chunk of money in there to counter the downward forces. You can see the impact in the significant nominal YoY drops in sales of existing residential properties (scroll down to find the "second-hand" data) in many cities. This is where weak collateral for bank lending administers a kick in the economic posterior. Clearly consumers are feeling the pinch - look at the last two food price updates. Producer price inflation is now trending down also, but not food. It adds up to an impressive margin compression. It looks like the Chinese economy is at an inflection point to me. CPI for January was still impressive, possibly boosted by the New Year.
Japan has so many problems that one cannot really cover them. Japan's worst problems are that with China sagging, it pulls growth impetus out of the system, and then the shut down of the nuclear power plants has raised their energy imports quite significantly. With the massive public debt they have, not to mention highly negative demographics, they are are facing a towering structural problem. The current theory is that they will raise sales taxes to compensate. All well and good, but then domestic consumption takes another hard drop, thus reinforcing the deflationary tendency. Only a deflated yen can help them much, but that's where the energy import-export balance looms far larger - deflating the yen will raise their structural cost of energy imports. End result - production moves out, domestic economy keeps deflating, gravity takes over and capital exits.
Europe's economy is weak to say the least, and the slide in the peripheral eastern bloc is likely to keep this going.
The only way I can resolve these fundamentals is to remark that most of the US population is in a recession. Real incomes must rise to get us out of that recession, and it appears unlikely that the US can borrow a whole lot more to boost real incomes without producing an almighty ruckus in the markets. We seem to be heading toward some sort of wall effect - the US population is dropping real consumption on stuff like food, utilities and fuel, but I cannot see this continuing for very long without it diffusing into retail because there is a natural limit on ability to adapt in this time frame. Mass-market retailers must be feeling the pinch right about now.
The US has some bright side left, but not enough to overcome significant inflation in the absence of significantly rising exports. We are muddling through so far on energy production and increased energy exports.
Friday, February 17, 2012
Potentially Dangerous Stuff
The Frankfurt-based ECB is exchanging its Greek bonds for bonds of an identical structure and nominal value, the only difference being that they would be exempt from so-called collective action clauses, the officials said late yesterday on condition of anonymity. One said the bonds have a face value of about 50 billion euros ($65 billion).We'll have to see how everyone reacts to this news. Two very large, very desperate central banks are battling to keep somewhat insolvent systems afloat. At the end of this month, ECB is set to conduct another money toss. We'll have to see how big that one is. If the net add between the two really is about 1 trillion, it's an immense sum - about 1.3 trillion dollars, of which at least 40% will find its way out of the heart of Europe by June.
The Fed is locked into buying long US Treasuries, and the world is locked into a rather dangerous game of cranking the money lever. Moves by smaller central banks probably mean little. Over the last year, US federal debt held by the public 2/15/2011 to 2/15/2012 has increased by about 1.1 trillion, of which the Fed acquired a net 480 billion +, approximately 43%, although letting the MBS run off changes the net annual add on the security buys to about 318 billion.
Now ECB is still going to have to fund additional sovereign purchases by European banks, because a lot more is due to come on the market this year. So overall the minimum net add from them probably goes to 1.4 trillion Euros? Holy Hannah, that seems like a huge number, but by summer that implies that the Fed plus the ECB dump a minimum net 900 billion USD into the international markets, of which probably only about 200 billion can be absorbed in "real" investments. If that's true, we are looking at a very big wave of inflation.
Most fundamental economic de-correlation (disaggregation) of trends occurs through changes in market pricing. What happens when you dislocate that mechanism?
If you were a hedgie, you would probably move your risk allocation away from shorter term sovereigns and into something else. Surely that will make these central banks double down on their bets, because aren't we losing the last set of possible market clearances?
In the meantime, India is forcing the import of more coal. Japan, of course, is locked into more fossil fuel imports to offset the loss of nuclear electricity production.
The US cannot be insulated at all from the inflation, because producer margins are not that good on many of the basics and the dollar cannot be that strong because let's face it, our goal is to keep it weak.
I'm looking at these numbers globally and they just don't add up. This seems sort of nutty. I doubt what's happening in China can really offset much of it, because although deposits at Chinese banks have stopped their epic rise, that just means that the flow of money into building stuff (which absorbs excess money) slows down.
Thursday, February 16, 2012
Stuff
US: Initial claims now drop below the recession line. This has to be good news, and given the results for January, it should be a good omen for the February employment report. Since we still are not creating jobs in great numbers, it's very helpful to net employment to see slowing jobs losses. Because many do not qualify for unemployment it is true that there may be a hidden positive bias in these numbers, but such a bias would have formed over the long term and would be relatively static over a period of a few months, so the very healthy trend we see in this report recently should be mostly real. Also reduced backups in state unemployment processing should make these numbers more reliable week-to-week because lower claims numbers mean that processing is more timely.
US Housing starts/permits. I believe that housing is trending positively. However the big difference between seasonally adjusted YoY comparisons and non-seasonally adjusted YoY comparisons leaves me with raised eyebrow this month. I still have this report in the category of "error bars too large
China: Consider reading a remarkably good Bloomberg article on Chinese banking, deposits, and the effect that efforts to subvert the Chinese government's unrealistically low deposit interest caps have on lending. The slowing of Chinese bank deposit increases last year probably arose from private lending returns, which were much higher. To fight that, Chinese banks are beginning to offer products that are essentially money-market accounts, but they don't count them as deposits, and of course their higher payouts cut into bank profits:
At the same time, deposit growth at Chinese banks last year slowed to 12.7 percent after rising 20 percent in 2010, central bank data show.This is not surprising at all, but it does have implications:
In January, depositors pulled 800 billion yuan from savings accounts, about 1 percent of the total, the central bank reported. It was the largest monthly decline in at least 12 years, according to data compiled by Bloomberg.
Chinese banks made 738.1 billion yuan of new loans in January, the lowest lending for that month in five years. The industry’s loan-to-deposit ratio climbed to 69 percent at the end of January, the highest since 2005, according to Werner, indicating that banks don’t have much room to grow their loan books.In every country, the loan to deposit ratio is a crucial banking stat. In the US, it has shifted sharply favorably. In China, it's going the wrong way.
Now if banks have considerable hidden losses on their books, which they do, lower rates of return magnify the effect of those losses, so bank lending should be constrained. Couple that with recent unfavorable trends in foreign direct investment in China, and contemplate the total effect. This is not the sort of thing that bookkeeping changes really affect much. These are fundamentals that indicate some pretty hard constraints forming for the Chinese domestic economy, the likely shift of more internal investment to external investment, and a downshift in money circulation for the Chinese economy as a whole.
The government can directly insert money into the banks. The government can directly provide financing to companies, but either of these two strategies are unlikely to show the same multiplier effects of the last decade. So now it gets interesting.
Wednesday, February 15, 2012
The Shrink Is Back, Posting About His Father
I think this series is important and I think you should read it. First part here. Second part here.
Recently I have become more and more haunted by the perception that our current problems, while real, are being hugely magnified by our collective failure to admit that they exist and attempt to deal with them. Thus, while we face a potentially dire prospect, most of the intimidation arises because we simply cannot stop being idiots. Collectively, that is.
The one thing my grandfather taught me (the one who escaped Germany, got into France, and from there got illegal papers and got to this country in 1929) was that you do not want to live in a country dominated by fantasy. Ever. When you see that happening, you get out and never look back.
But I don't think getting out will do it this time - I don't think there is any place to run. So the only recourse is to fight for reality here.
Tuesday, February 14, 2012
Not Dead, Just Programming
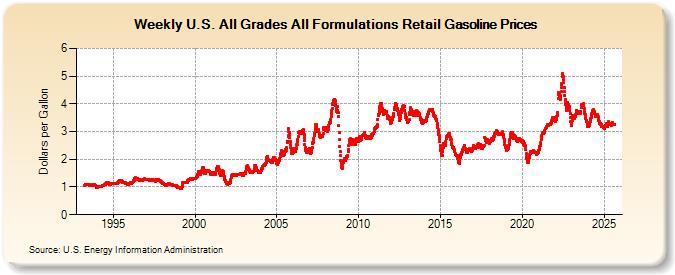
A) Looks waaaay too much like the drop in gas consumption to be dismissed, and
B) Cannot be ignored. Nor is it sudden - except in November, when Christmas lights apparently cut in to bring a marginal month on month increase, power consumption kept moderating.
C) We are not seeing the compensatory effects we should see from the weather explanation. If people are spending less on utilities, they ought to have more to spend on food and gas, but instead we see a sustained drop in the mass market indicators. Howard Davidowitz wins again.
This is part of the rocker effect you see in a skipping recession. If a skipping recession continues too long, it can turn into a deflationary cycle. However shoving prices up probably makes the deflationary cycle worse - you have to look carefully at the economic system and see where the constraints are before you start tinkering. End update.
\One of my brothers called me last night to ask if I were dead due to the fact that I had not posted on this thing since Wednesday. I have been programming, and time flies. I had not realized it was that long. I am deep in the heart of this project, making good progress, and enjoying myself. Let me enjoy my happy nerdish peace.
As for the Europeans, OMG. I think this is a fatal error with Greece. I know that the Greeks did this to themselves, but if you construct a situation in which people are told that even their votes in elections don't make a difference, you have created an extremely unstable society. Perhaps technically things would be better for the Greeks if they followed the deal, but without the ability to form a popular consensus to follow the deal, they will not follow it no matter what the politicians do. So it's a major fail, and this is not going to help the cause of united Europe.
US - most the data has assumed an interesting up-down sequence. That means that a lot of the seeming variance is in the seasonal adjustments, which means real growth is neither brilliant or abysmal. That's probably the explanation for the oddities in the retail report. On an unadjusted basis (NSA), and also non-price adjusted basis, January retail sales total increased 5.6% over the previous January. The previous January probably had more weather impacts, so the actual might be a bit less. Autos increased 8%, which squares much better with the industry reports than the official "adjusted" number. Restaurants and bars are up 7.2% over the year. That's quite good - a real increase even allowing for price increases.
Bad stuff in retail report: Food and beverage sales increased just 3% YoY unadjusted. Since food prices have increased considerably more than that, this means real food sales are still falling. Even allowing for the possibility that Americans have really gone on a major post-Christmas diet, this is not a good economic sign. It points to financial stress for many households. Pharmaceuticals increased only 1% over the year. Probably a lot of this is diversion of sales to Canadian pharmacies. Much higher copays are hurting pharmaceuticals in the US.
I think milder winter weather is really helping. About 30% of households should be gaining an average $200 in real spendable income per month, probably averaging around $500 net. That's a big assist to real incomes. Why don't I see that in food? It ought to be there!
Rail traffic started out the year quite low, but part of that was due to a calendar difference. Through the first week in February, the YoY recovered quite a bit. Carloads are up 1.3% YoY, and intermodal is up 4.5% YoY. If you have time, click on the link and look at the vehicle-related. Much stronger than last year - autos are still helping us. By the third week in February this data will be more comparable, although it is getting an assist from the weather. Carloads would look a lot better if it weren't for the coal - enough of those plants have been shut down that it is affecting this series.
Business inventories - no sign of a lump developing there.
NFIB - kind of flat, but at least we have recovered from the summer doldrums last year. Maybe small businesses are getting some of the fuel money. If we are seeing any startups, this series should be biased a bit downward right now. Outlook was -3 in January, which is depressingly low compared to the prior January's +10, but one heck of a recovery from the summer low of -26. Employment gains really aren't showing up in this survey very well. Yet. If sales recover than they will.
The Best: January Treasury wage receipts finally showed that pop. It seems to have taken forever, but AT LAST we got the nominal jump I was looking for. Therefore I would say that the January employment report gains were real.
HI Receipts January 2011:Finally!!! A REAL gain. Not only that, but we have the participation of smaller businesses. Looking at NFIB, I'd say a good hunk of that is construction.
Wages: 15,533
Self: 2,233
HI Receipts January 2012:
Wages: 16,601 (+6.9%)
Self: 2,377 (+6.4%)
The Fed would be foolish to do much given this result, and for now they won't. ECB is throwing enough money for both of them, and after the next money toss at the end of this month, we should see the pace of inflation pick up again. Not only is the ECB throwing a lot of money, but it is throwing it desperately and in huge gobs. In a lot of ways this has stabilized sovereign finance for Europe in the near term, but it is doomed to cause inflation. I'm guessing the inflection point on that is around June, when things should get pretty incendiary.
The interesting thing about the ECB measure is how uncontrollable it is. European banks are still withdrawing money from ex-Euro lending areas directly, but the European banks are clearly using large fractions of the Dragon's Breath Infusion to pay off creditors, and European banks had extensive investment from foreign investors. Those extra Euros are going to show up all over the place.
Going forward, US bank ratios are very good. If you read the NFIB report, the only problems these businesses don't have is credit. We are near the series low on that. And from looking at H.8 2012 Jan SA numbers, we can see why:

This is other deposits (top line at right side of graph) against all loans and leases in bank credit. Good - oh. Mind you, this is short term money so you don't want to buy long term Treasuries with it!
Other deposits are shooting up again. This is particularly interesting given the rapid payoff on the CCs, and it hints at a real improvement in jobs in January, because tax refunds haven't hit yet.

No, Virginia, US consumers did not suddenly go hog wild and charge up their credit cards again. The trajectory is still down.
Americans are building up more credit on car loans and tuition loans, both of which show up poorly in banks. The government (taxpayer) gets the unpayable student loans, and the garbage credit industry, which is mostly ex-banks, gets the bad auto loans.
I was worried that we'd run out of garbage credit too soon, and that it would hurt autos, but I don't think so now. The used car market is so strong that it really cuts losses on garbage car loans, and it also cuts net borrowing needs for those who have a vehicle to trade in that's not too old. That's good news for auto manufacturers, and good news for consumers who have a viable car to trade in.

This is all loans and leases in bank credit and C&I loans in bank credit. We are still improving, and most of the improvement is in C&I. Some of this may be due to inflation, but there appears to be a real improvement.
So the Fed has no need to join the current Money Toss Olympics.
It is possible that even the Chinese will refrain, because they are going to be feeling the effects of the Euro Hurl.
Wednesday, February 08, 2012
Why Santorum Won Last Night
Now there are two types of jobs in this country. One type, on which the coasts substantially run, are generated through beyootiful flows of government money. That is why the DC metro area is doing so well jobs-wise. They are closest to the spigot. These jobs are dependent mostly on getting your paws on gobs of other people's money, and/or moving money around in gobs.
The other types of jobs are Main Street jobs, and are generated by the rolling consumption and production in the Main Street economy. They tend to vary more with industrial and consumer strength, they tend to be less prestigious, they tend to generate less income, and they employ a whole heck of a lot more people.
So if you are GOP on the coast, you are for Romney, because you are a money-mover. If you are GOP in the heartland, you've already realized that the jig is up, and you are for Santorum. The wheels of commerce in your area ride much closer to the ground, and you have had a good long look at the bare tread on those tires. You are scared and you know something's got to give but soon.
It's not exactly that those heartland people are illiberal. The vast majority of the public strongly supports the basic social welfare net, including Social Security and Medicare. No, the reason the people in the heartland think the jig is up is that they know in their bones that we are getting to the point at which we cannot sustain those programs.
This is the reality that the people in the heartland are experiencing:

Open this one up and take a good long look at it.
This is per capita real disposable personal income indexed to the trough of the recent glorious recession, which was June 2009.
Ugly facts:
- US per capita real personal income as of December was most like that of September 2006, when by the indexed measure it was 100.7 compared to December's 100.9. By December of 2006, it was at 101.7.
- Per capita real personal disposable income rebounded after the late glorious exercise in economic frothiness, eventually rising to a peak of 101.7 in December of 2010. It stuck there for a few months, and then resumed its fall.
- We have achieved this decline in real per capita personal disposable incomes in spite of a 2% FICA tax cut, which we cannot afford to sustain and cannot afford to end. If we did end it without instituting something on the order of the Making Work Pay tax cut, we'd immediately fall into an outright recession.
- Five years? Five years no flipping growth in real per capita personal disposable incomes?

- Our fiscal base is declining. This was amply covered in the royally depressing CBO 2012-2022 Economic Outlook just published. It's only 165 pages, which I have read twice since Friday's employment report.
- That report lays out some pretty dire predictions. Ignore the baseline scenario, which is constructed on the payroll tax cut ending this month, and taxes being raised hugely next year. No, you want to look at the alternative scenarios and most importantly, the trust fund section.
The trust fund section is in Appendix D. Click on the bookmarks. Note that the DI trust fund is now projected to be exhausted during the course of 2016, which legally means that benefits are cut about 18-22% at that point. Less than five years from now. CBO assumes that we keep paying benefits anyway. Social Security deficits are vastly increased - by 2016 they are 38 billion annually, and in 2022 they are well over 100 billion annually. DI deficits are 43 billion in 2016 but remain pretty static through the rest of the forecast. The Hospital Insurance deficit is somewhere around 30 billion in 2016 but decreases slowly after that, this being due to a number of tax/premium increases plus other scheduled changes.
In the beginning of Appendix D CBO has helpfully pointed "Golly gee, Gomer, there ain't no money in them thar trust funds. What matters is cash flow." They phrased it slightly differently:
The balance of a trust fund at any given time is a measure of the historical relationship between the related program’s revenues and spending. That balance (in the form of government securities) is an asset for the individual program, such as Social Security, but a liability for the rest of the government. The resources to redeem a trust fund’s government securities—and thereby pay for benefits or other spending—in some future year must be generated through taxes, income from other government sources, or borrowing from the public in that year. Trust funds have an important legal meaning in that their balances are a measure of the amounts that the government has the legal authority to spend for certain purposes under current law, but they have little relevance in an economic or budgetary sense.Thus, CBO is figuring the actual budget deficit from trust operations through the period (trust funds include Highway and government/military retirement programs) and came up with this, beginning in 2011:
 At the end of the period it is over 900 billion annually.
Something's going to give. CBO points this out (page 23 internally):

The WWII debt was manageable because we entered into a period of prolonged growth due to international factors and demographic factors, and because the WWII debt was not generated by structural excesses.
Our current debt is now mostly going to rise due to structural excesses. The recession "bump" is over - now social spending takes over. Needless to say the alternative scenario is not sustainable and will generate an epic crash down the road.
Oddly enough, the US public seems to know this but the politicians have not caught up.
Friday, February 03, 2012
January Employment 2012
I think I mentioned this last month, but every January the population basis is adjusted for the Household Survey.
This introduces discontinuities. These numbers honestly are not directly comparable to the previous month. Some of the basic ratios shouldn't be that affected. Those are labor participation rate, which at 63.7% is a new low and may well have been affected (last month was 64%), the emp/pop ratio, which at 58.5% did not change from November or December but should be affected, and the unemployment rate, which fell again to 8.3%. That may have been affected. Nonetheless, the previous January the rate was 9.1%, so you can't say that this isn't improving. Also there was steady improvement in the previous few months, so another fall would not be unexpected.
But instead of babbling on about the changes, here is the table listing the effect:

In the next two months it will all smooth out and the running totals will become comparable again.
There's a strong hint in these adjustments that retirements are having a pretty big effect. Many of those retirements are from public employment, and those retirees are far more likely to actually exit the workforce and be replaced by younger workers. We also have a growing number of small business owners who can qualify for Medicare and thus will shut down their businesses, so it's not quite as positive a net effect as it appears. If you don't have retirement medical benefits, and if you can continue to work, you will do so.
Turning to the Establishment Survey, and ignoring the headline number of 243+ jobs, some observations:
- I expected the substantial increases for construction/reconstruction labor in the last two months. These are positively affected both by the pace of activity and highly favorable weather. Construction was +21K in January and +31K in December, and I think that those numbers are a bit overstated by seasonal adjustments, but do contain real increases.
- Increases in manufacturing are likely to be real, and probably highly associated with autos and derivatives, based on freight patterns. They are almost solely in durable manufacturing.
- Manufacturing increases create a lot of subsidiary jobs, and when you look at the whopping reported increase in private services of 176K, it's notable that there was a big increase in professional and business services. This makes sense - temporary help is up too.
- The retail and warehousing/transport categories saw healthy gains. I think these numbers are strongly supported by the claim activity we saw in January - these sectors ramped up and probably retained some of the new hires.
- Information, financial and government were the weak categories. The information drops may be mostly related to financial activity.
The number of discouraged workers reported increased from last January, rising from 993,000 to 1,059,000. Long term unemployment numbers are still excruciatingly high. It's very worrisome - that number barely drops, and probably contains a high proportion of older workers and those with some labor limitations.
Unemployed over 27 weeks:

\
\Full-time workers - you can make a good case that part-time employment will inevitably rise as older workers seek part-time employment, but what about younger workers that can't make a living, have no possibility of medical benefits from their job, and no hope of really improving matters? A lot of people think we have slackers galore, but you are going to see food stamp usage and so forth rising with labor stats like these:

I don't even want to think about Obamacare subsidies in 2014. The whole plan has to be reworked. There is not a chance in hell we can afford it.
Thursday, February 02, 2012
Moneta di Popolo!
President Giorgio Napolitano's salary is a case in point: the head of state makes €230,000 per year. Yet a senior shorthand writer in parliament can earn up to €270,000 annually. Such sky-high wages for non-elected staff make up 25 percent of the total cost -- more than €400 million a year.So let's face it - you don't want to be Warren Buffet's secretary. You want to work for the Italian Parliament. Or better yet, the Sicilian parliament. Sicily is unique. You honestly could be a school teacher there and retire with a pension in your forties.
No one can quite pin the cause down, but apparently the Italian public is a bit miffed. Occasionally this happens, and when the Italians finally stop drinking and cursing and decide to do something about it, politicians wind up swinging from the lampposts. The rest of this year in Italy should be very interesting. There has been some wild speculation that increases in the retirement age may have irked a few people, but personally I think the labor flexibility rules are going to cause more havoc. Pissing off a Sicilian cab driver is hardly the safest measure.
No one says that much about Sicily, because they are more efficient at these things than the rest of Italy. Instead of wasteful mobs decorating lampposts they just leave a few neat bodies when things heat up. That happens about twice a week on average, but the mood has been somewhat intransigent ever since they attempted to crack down on money laundering through the Vatican. That just wasn't cool.
I don't know what will happen this year in Italy, but I am sure that Italy will not wind up being anything like Germany. Most of the announced changes are actually up for negotiation later.
I'm not joking about this - the current unsettled status did start in Sicily, the control of the usual umbrella labor/social groups has completely broken down over much of Italy, and the situation will continue to develop in baroquely fascinating ways. Whenever the hard core Catholics, the Stalinists and the Sicilians get together, something's gonna happen. In most countries, it would be difficult to form such a coalition, but in Italy it just happens.
Forzanuova's current cry is "Moneta di popolo!" As far as I can make it out, the communists are wanting that to be a fixed allocation to citizens of internal money, and Forzanuova isn't even bothering to call for a national currency - it seems to want to issue local currencies. It sure looks like an increasing number of shopowners, farmers and those all-important truckers and cabdrivers are willing to go with it. See, this is why you should not try to really collect taxes in Italy. If the local shopowners sign up and accept the script, that's it. Game over. You]ve got small business against big business and rural against city, and they might well develop a dual monetary system. All those lovely policies about limiting cash transactions become ever so theoretical.
So my conclusion is that the the Italian government's pronouncements have very little to do with what is going to happen. Bondholders, beware. We have gone straight to Defcon 4, which in Italian is something quattro equating to 1 nuovalira = quattro Euro.
Draghi = dragons. monti = Mountains. This looks to be turning into the Dragon's Mountains of Debt, and it really doesn't look as if it is going to be paid.
On Thin Ice, But....
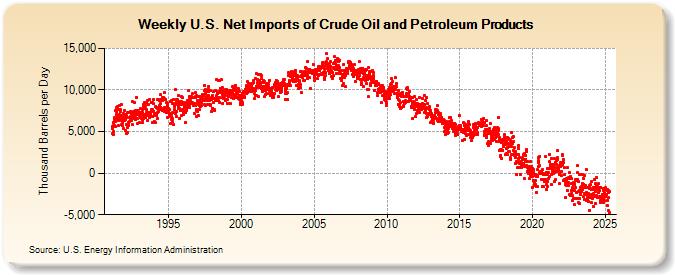
No matter how you look at it, we started 2012 weaker than we started 2011. And not just marginally weaker. GDP wasn't good, Chicago PMI showed some relative weakness at 54.9 with an outright contraction in order backlogs, NACM started the year about 2 points lower than it did last year, with payment related weakness, petroleum consumption is exceedingly weak, with net imports down over 15% YoY (YTD), and:
Total products supplied over the last four-week period have averaged just under 18.2 million barrels per day, down by 4.3 percent compared to the similar period last year. Over the last four weeks, motor gasoline product supplied has averaged about 8.1 million barrels per day, down by 7.3 percent from the same period last year. Distillate fuel product supplied has averaged 3.6 million barrels per day over the last four weeks, down by 1.7 percent from the same period last year. Jet fuel product supplied is 4.1 percent lower over the last four weeks compared to the same four-week period last year.The consumer side is not very strong. At all. Even factoring in retirements, it's hard to account for this three month move into the dark. It does match well with utility figures, which have been poor.
Weather does not account at all for the striking decline in gas consumption, and fleet replacement cannot account for it either. Weather ought to have stimulated gas consumption. So should theoretical employment figures.
There is light stocking in many stores. Rail figures are not a bright spot so far, with YTD carloads only up 1.1% and intermodal (trailers/containers) only up 0.4% YoY.
Jobs figures have generally been good, but Treasury Hospital Insurance receipts for December were really very poor. They only increased 2% YoY, and that means that real wages in the US, in aggregate, declined from December to December. This explains a lot of what we are seeing. I have stared and stared and stared at the Treasury figures. They do not change. Every once in a while Treasury will correct them, but not this time. HI-self was at 170, same as December 2010. HI wages (charged on all wages and salaries) was at 17,135 compared to December 2010's 16,788. CPI-U in December was at 3%, CPI-W was at 3.2%, and food at home for those unfortunates was still up 6.1% YoY. The lower the income, the higher the real inflation rate for consumers, and it is not hard to understand why food and gas consumption is falling.
On the bright side, a milder winter should be putting some money back into consumers' pockets in the form of lower heating costs, initial claims are subdued, continuing unemployment claims are following a steady to downward trajectory, and a milder winter should really help construction, which is one of the US bright spots.
Now the petroleum consumption thang is not just a feature of the US. European brent is being exported to Asia, since Libyan production is back up. There is a notable downward global shift in the background economy.
At this point, my forecast for no outright US recession in 2012 is in peril. The only thing that will save it is if inflation drops. Inflation has been very segmented to the lower end of consumption, so we have an odd situation in which real incomes for higher earners have risen while real incomes for lower earners have plummeted. This is not stable.
Remember, last year we had high inflation, but a lot of consumers were helped earlier in the year by the 2% FICA cut, which we have maintained, but cannot increase.
CBO's deficit prediction for 2012 is 1.1 trillion, which is a 10% increase from last summer's estimate. Federal Debt Held By The Public is rocketing up - it is now at 10.5 trillion. That takes us to about 78.7% Debt/Real GDP. We are crossing the first danger line (> 80%) very decisively this year. To put this in perspective, from Q4 2010 to Q4 2011 real GDP grew by 206 billion dollars. We are not going to do much better this year under the best estimate, unless inflation drops hard, so we are looking at adding 300 billion MAYBE to real GDP and a trillion to the debt? This now becomes daunting - the markets are going to start flinching when we get close to 85%, and my best case scenario is be at about 84% Floated Debt/Real GDP in a year.
Inflation doesn't help us at all, because of per capita real income. See Table 2.1 in the National Accounts. Per capita real income reached its height in this cycle (emergence from recession) in Q1 2011, largely because of the FICA tax cut. It reached a high of 33,826 in 2008, fell to a low of 31,806 in Q4 of 2009, rose again to 32,724 in Q1 of 2011, and since has declined to 32,407 in Q3/Q4. The figure for Q4 is of course quite pr
Uncertainty factors for business remain very high, therefore. Businesses cannot possibly know what the tax environment will be next year. There is space to raise taxes marginally on higher income earners. Not a whole lot, and tax increases are already passed in law to some extent, so you have to watch it.
Well, I'll go over the CBO predictions and so forth in the next installment of the gold bond series, but it is going to be hard for businesses to invest a whole lot of money in expansion in the current circs. The BS reports about consumer credit increasing a whole lot have indeed turned out to be BS. Take a good look at H.8, and scroll down to the weekly. Consumer loans are about where they were in October. There is an increase in other consumer loans (includes cars) and a decrease in CC/Revolving. Deposits are gaining, but slowly. C&I lending is up, but we have to wait for a bit to see the real trend.
Therefore we don't have help from the credit cycle. We cannot have a lot of help from incomes in the short term. We aren't going to get a big surge in business investment, except for energy. We cannot look for a lot of federal handouts, because that will prove counterproductive.
Energy is an assist. Housing is recovering some places, with new home builders in some areas seeing a pick-up. Some positives, some negatives, very little net growth impetus.
I'm guessing that we are retiring well-paid jobs and replacing those with lower-paid jobs. Tomorrow's employment report will be interesting indeed.
See Ward's.

For laughs. Indiana's "Think".
![]()
