 MaxedOutMama
Monday, September 10, 2007
OK, Here We Go
The real ride on the roller-coaster is just beginning. Friday's shock and awe employment release embodies features which deserve a post of their own. Now to the rest of the numbers and news which matter (because many of it doesn't, and many of them are produced to mislead):
1) HSH Trends is a good weekly read. It contains valuable commentary. HSH is a financial services company which is less of a special interest than MBA, and I find their numbers much more reliable. It is updated after each Friday. As the numbers for last week show, mortgage rates for non-exotics (which now include many jumbos) have turned and are heading downward again. This is largely a measure of diffusion of economic weakness; it indicates that the pool of such borrowers is rather limited and that there is pretty intense competition for decent borrowers.
2) Sheila Bair of the FDIC spoke to Congress on 9/5. Her speech is worth a read, both as a summary of what has happened (dumbed down to Congress Critter level), and because of some of the comments in it. However, it should be read with Coast Bank in mind. That was a severe failure of the FDIC's. Also consider Fremont. Both of these organizations were permitted to continue in unsafe and unsound dealings for a very long while. There are others, too. Therefore, you should take Sheila's statements about the health of the banking industry with at least half a shaker of salt. However her statements about how things should work are solid, such as these tidbits:
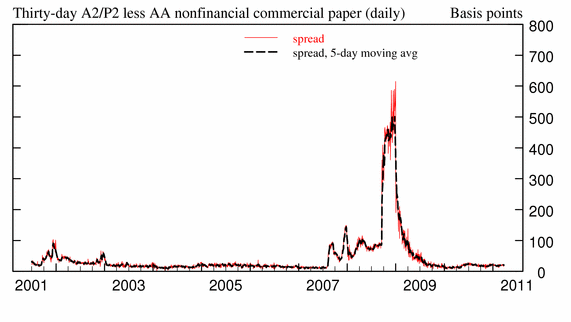
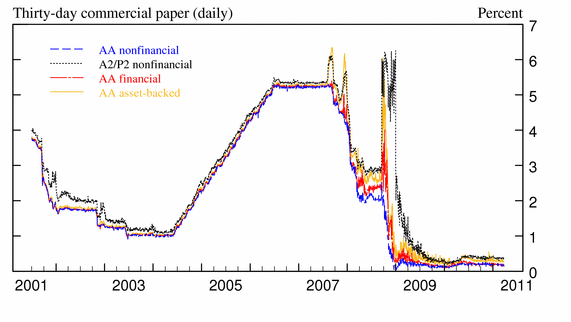
3) Commercial credit conditions continued to degenerate last week. Over the week, Treasury yields consistently dropped after having begun a long slow rise in late August. Take a look at the FRB Commercial Paper release; risk premiums had stabilized but then started another upward climb last week:
and
Also, as I noted last week, Thursday's release documented yet another implosion in outstanding commercial paper, with a troubling extension of that drop into non-financial. Two Bloomberg articles provide more commentary on the situation; another 140 billion in CP is up for grabs, and the big financial corporations are viewed as completely subprime credit risks.
There is rough justice in this situation, but unfortunately the pain is being rapidly transmitted to the innocent bystanders. Loans to smaller businesses are being called in to bolster bank balance sheets. The wicked impact of a significant credit contraction is that you can't call loans to the dicey businesses unless you know that they will be able to repay them, so instead loans to healthy firms are called.
4) On Saturday, Plosser of the Fed gave a speech in Hawaii destined to go down in history as the "Don't Worry, Be Happy" speech (ref to CR). Neither Plosser nor Bair are being realistic about what is happening; the economic impact on small businesses will be quite devastating in some areas. First the bad money drove out the good, and now the bad debt is being covered by calling in good debt. This is not a process of economic rationalization. Heck, even in triage in a war, the effort is to treat those who will survive, instead of tossing out those who would be likely to survive in favor of the terminal cases. But survival, in this case of the institutions who must pull money back in order to survive, is the name of the game. In any case, those smaller businesses account for a hefty chunk of new employment.
5) It's international, stupid. Australia's central bank is allowing banks to use these types of assets as collateral for repo-type loans. Japan's GDP for the second quarter was revised to show a 1.2% annualized decline. The containment is international too, I suppose.
6) The main number that truly, truly matters is not a number that came out last week. It's the ratio of financial corporate profits to non-financial corporate profits as chronicled in years' worth of GDP releases. The number that is the strong predictor in GDP releases is Gross Private Domestic Investment, which has followed the following trajectory of change (see Table 4 at this link):
The financial services industry was a large contributor to the information sector, to commercial building and rentals of commercial office space, and to well-paid employment. The diffusion will be very rapid.
Update: Stagflationary Mark over at Illusions of Prosperity graphed the financial industry profits as a percentage of all corporate profits since 1993, complete with a trend line. I think you'll find it interesting, especially the hump over the last recession. That was when nonfinancial profits slumped, but the debt-fueled economy (consumer spending) stayed strong.
1) HSH Trends is a good weekly read. It contains valuable commentary. HSH is a financial services company which is less of a special interest than MBA, and I find their numbers much more reliable. It is updated after each Friday. As the numbers for last week show, mortgage rates for non-exotics (which now include many jumbos) have turned and are heading downward again. This is largely a measure of diffusion of economic weakness; it indicates that the pool of such borrowers is rather limited and that there is pretty intense competition for decent borrowers.
2) Sheila Bair of the FDIC spoke to Congress on 9/5. Her speech is worth a read, both as a summary of what has happened (dumbed down to Congress Critter level), and because of some of the comments in it. However, it should be read with Coast Bank in mind. That was a severe failure of the FDIC's. Also consider Fremont. Both of these organizations were permitted to continue in unsafe and unsound dealings for a very long while. There are others, too. Therefore, you should take Sheila's statements about the health of the banking industry with at least half a shaker of salt. However her statements about how things should work are solid, such as these tidbits:
Although these events have yet to fully play out, they underscore my longstanding view that consumer protection and safe and sound lending are really two sides of the same coin. Failure to uphold uniform high standards in these areas across our increasingly diverse mortgage lending industry has resulted in serious adverse consequences for consumers, lenders, and, potentially, the U.S. economy.Haha! First, that's the front ratio she's discussing, and second, front ratios of 50% are not stable. Here she is setting the bar very high indeed; most mortgages that have front ratios of 50% will default, and such ratios have always been the hallmark of predatory lending. The exceptions to this rule are temporary low income for the borrower, borrowers with high assets, borrowers with very high incomes, and borrowers with high equity. If you are "fixing" the problem with front end ratios of 50%, you are not fixing the problem. This is a rather shocking statement.
...
Among mortgages packaged in non-agency securitizations, nontraditional mortgages rose from just 3 percent of nonprime originations in 2002 to approximately 50 percent by early 2005.
...
Subprime and Alt-A loans together stood behind 77 percent of all private ABS outstanding as of May of this year.
...
The transactional nature of the "originate and sell" model has contributed to lending practices that have damaged the immediate interests of consumers, mortgage lenders and mortgage investors, and now pose a risk to the broader economy. The housing boom has given way to declining home prices in an expanding list of U.S. metropolitan areas. Mortgage delinquencies and foreclosures are on the rise not only in subprime portfolios, but also in Alt-A portfolios, where risk layering is now contributing to credit problems that are no longer being masked by home price appreciation.
...
Credit concerns now extend more broadly to leveraged commercial lending.
...
It is equally important that when working with financially stressed residential borrowers, servicers should avoid temporary measures that do not address the borrower's ongoing difficulty with unaffordable payments. Institutions are encouraged to work toward long-term sustainable and affordable payment obligations that will provide stability for servicers and investors as well as borrowers. Clearly, fixed rate obligations provide the best opportunity to long-term stability. In developing a strategy to address payment difficulties, it is essential that servicers, as well as lenders, realistically evaluate the borrower's ability to repay the modified loan. One methodology commonly used by servicers is an analysis of the borrower's resulting debt-to-income (DTI) ratio. The DTI ratio should include the customer's total monthly housing-related payments (i.e., principal, interest, taxes, and insurance) as a percentage of their gross monthly income. In issuing the interagency statement, the FDIC and CSBS noted that, absent mitigating circumstances, resulting DTI ratios exceeding 50 percent will increase the likelihood of future difficulties in repayment and delinquencies or defaults.
3) Commercial credit conditions continued to degenerate last week. Over the week, Treasury yields consistently dropped after having begun a long slow rise in late August. Take a look at the FRB Commercial Paper release; risk premiums had stabilized but then started another upward climb last week:
and
Also, as I noted last week, Thursday's release documented yet another implosion in outstanding commercial paper, with a troubling extension of that drop into non-financial. Two Bloomberg articles provide more commentary on the situation; another 140 billion in CP is up for grabs, and the big financial corporations are viewed as completely subprime credit risks.
There is rough justice in this situation, but unfortunately the pain is being rapidly transmitted to the innocent bystanders. Loans to smaller businesses are being called in to bolster bank balance sheets. The wicked impact of a significant credit contraction is that you can't call loans to the dicey businesses unless you know that they will be able to repay them, so instead loans to healthy firms are called.
4) On Saturday, Plosser of the Fed gave a speech in Hawaii destined to go down in history as the "Don't Worry, Be Happy" speech (ref to CR). Neither Plosser nor Bair are being realistic about what is happening; the economic impact on small businesses will be quite devastating in some areas. First the bad money drove out the good, and now the bad debt is being covered by calling in good debt. This is not a process of economic rationalization. Heck, even in triage in a war, the effort is to treat those who will survive, instead of tossing out those who would be likely to survive in favor of the terminal cases. But survival, in this case of the institutions who must pull money back in order to survive, is the name of the game. In any case, those smaller businesses account for a hefty chunk of new employment.
5) It's international, stupid. Australia's central bank is allowing banks to use these types of assets as collateral for repo-type loans. Japan's GDP for the second quarter was revised to show a 1.2% annualized decline. The containment is international too, I suppose.
6) The main number that truly, truly matters is not a number that came out last week. It's the ratio of financial corporate profits to non-financial corporate profits as chronicled in years' worth of GDP releases. The number that is the strong predictor in GDP releases is Gross Private Domestic Investment, which has followed the following trajectory of change (see Table 4 at this link):
2004: 3.4It is choppy by quarters, but here is the sequence since 2004 extending into the second quarter of 2007:
2005: 4.2
2006: 3.5
2004: 4.1, 4.7, 3.9, 3.9,Table 12 at the above link gives corporate profits. You will note that they are split out betweeen financial and nonfinancial industries (gross numbers, seasonally adjusted and annualized for quarterly data):
2005: 5.2 , 2.8, 4.0, 5.8,
2006: 4.0, 2.5, 1.6, 2.2,
2007: 2.0, -.2
Year, Financial, Non-Financial, Ratio
2004: 356.2; 681.6; 52.3%
2005: 405.5; 749.1; 54.1%
2006: 482.2; 814.3; 59.2%
2007 quarters:Financial profits are now doomed to fall, which is going to have a hefty downward impact on the economy. Real consumer median incomes peaked back in 1999. Consumer spending since then has been increasingly financed by debt, which is a withdrawal of future spending power for consumers. As these numbers show clearly, a shock in the financial sector will have a much bigger impact on the domestic economy that it would have had a few years ago. Profits for non-financial corporations were lower in 2nd quarter 2007 than in 2006! We are facing a crumbling leading edge. Manufacturing is getting some boost from a weakened dollar, but it will take a long time to make up for the shock in consumer and financial spending.
Q1: 468.7; 781.1; 60.0%
Q2: 525.4; 806.4; 65.2%
The financial services industry was a large contributor to the information sector, to commercial building and rentals of commercial office space, and to well-paid employment. The diffusion will be very rapid.
Update: Stagflationary Mark over at Illusions of Prosperity graphed the financial industry profits as a percentage of all corporate profits since 1993, complete with a trend line. I think you'll find it interesting, especially the hump over the last recession. That was when nonfinancial profits slumped, but the debt-fueled economy (consumer spending) stayed strong.
Comments:
<< Home
I know what you meant to say but you actually said; "another 140 billion in CP is up for grabs, and the big financial corporations are viewed as completely subprime credit risks."
That $140bn in commercial paper is already out there in the market. It is coming due in the next few weeks. The worry is that it will not roll over because the IBs need cash to cover their shortfalls in the mark to market for their residential real estate collapse.
Now everyone knows the commercial borrowers cannot find $140bn in cash. They'll be squeezed into high rate onerous pier loans that will be papered over in an accounting trick or twelve.
The word you are looking for is "recession."

I meant up for grabs as in seeking a home. I think about 90-120 billion will find some sort of accommodation.
The situation is unnerving at best.
The situation is unnerving at best.
Your article inspired me to create a chart that shows the percent of domestic profits coming from financial sources (going back to 1993).
Financial "Innovation"
Financial "Innovation"
maxedoutmama,
Why are we using the financial and nonfinancial numbers in lines 3 and 4 in Table 12 and not the ones further down that appear to use "inventory valuation and capital consumption adjustments?"
Why are we using the financial and nonfinancial numbers in lines 3 and 4 in Table 12 and not the ones further down that appear to use "inventory valuation and capital consumption adjustments?"
Disregard that last question of mine. I see how the data is laid out now and it makes sense. I just misread the headings.
Post a Comment
<< Home
![]()
