Thursday, October 16, 2008
Unemployment Claims
I haven't been commenting on unemployment much because of the hurricane-induced discrepancies, but now that is fading out of the numbers. NSA continuing claims for October 4th were 3,061,651, nearly a million more than the comparable week in 2007.
Industrial production fell for September, but that month is not comparable. However August industrial production was revised down to -1.0, and that is very significant. What seems to have happened is that cooler temperatures, more cautious consumption, and slowing manufacturing across the US dropped utility demand, which has been a large factor in the headline industrial production slump over the summer. In May, July and August utilities were down over 2% each month.
According to the FUT numbers earlier, this was going to happen. FUT is a very, very strong indicator for domestic economic activity. Interestingly, over the last couple of months FUT has stabilized a bit, which is one of the factors that supports my theory that the US domestic economy is going to hit trough in second quarter 2009. We'll see! If the credit situation isn't managed properly, the whole thing could head down very sharply.
Recent claims activity:
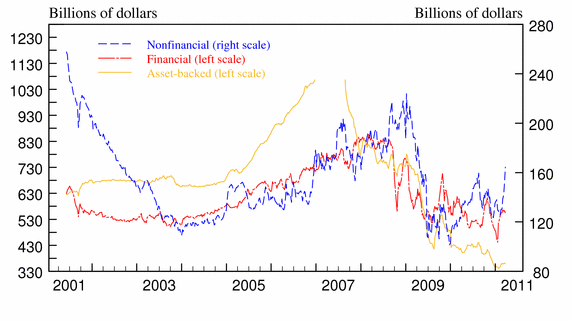
So far so good on commercial credit. It's the blue line here that you care about:

Non-financial totals over the last few months have grown a bit.
I think Roubini is wrong, unless we screw up horribly, or ROW does. And as for ROW, India's wholesale inflation is beginning to creep down, and lower energy prices are helping somewhat.
The big ROW issue is Europe. Do the eastern European loans start defaulting at high rates? There is a load of trouble coming down the pike having to do with credit default swaps on commercial credit in Europe, commercial loans defaulting, and property value drops in some boom areas. How well that can be managed is the biggest question.
Industrial production fell for September, but that month is not comparable. However August industrial production was revised down to -1.0, and that is very significant. What seems to have happened is that cooler temperatures, more cautious consumption, and slowing manufacturing across the US dropped utility demand, which has been a large factor in the headline industrial production slump over the summer. In May, July and August utilities were down over 2% each month.
According to the FUT numbers earlier, this was going to happen. FUT is a very, very strong indicator for domestic economic activity. Interestingly, over the last couple of months FUT has stabilized a bit, which is one of the factors that supports my theory that the US domestic economy is going to hit trough in second quarter 2009. We'll see! If the credit situation isn't managed properly, the whole thing could head down very sharply.
Recent claims activity:
The highest insured unemployment rates in the week ending Sept. 27 were in Puerto Rico (5.3 percent), California (3.2), Michigan (3.2), Nevada (3.2), Oregon (3.2), New Jersey (3.1), South Carolina (3.0), Pennsylvania (2.9), the Virgin Islands (2.8), Arkansas (2.7), North Carolina (2.7), and Rhode Island (2.7).Look at the states with increases of more than 1,000 as of October 4th:
The largest increases in initial claims for the week ending Oct. 4 were in Ohio (+7,217), California (+6,003), Michigan (+5,661), Florida (+4,253), and Alabama (+3,471), while the largest decreases were in Texas (-21,249), Louisiana (-5,461), Mississippi (-1,108), Washington (-809), and Kentucky (-525).
| State | Change | State Supplied Comment | |
| DE | +1,239 | No comment. | |
| MA | +1,353 | Layoffs in the public administration, finance, insurance, trade, and service industries. | |
| VA | +1,474 | Layoffs in the automobile and manufacturing industries. | |
| IL | +1,494 | Layoffs in the trade, service, and manufacturing industries. | |
| NJ | +1,844 | Layoffs in the trade, service, transportation, and manufacturing industries. | |
| IN | +1,848 | Layoffs in the automobile and manufacturing industries. | |
| AR | +2,275 | Layoffs in the manufacturing industry. | |
| TN | +2,336 | Layoffs in the service and transportation equipment industries. | |
| NY | +2,410 | Layoffs in the construction, service, and manufacturing industries. | |
| WI | +2,617 | Layoffs in the construction, transportation, warehousing, and manufacturing industries. | |
| PA | +2,734 | Layoffs in the food, mining, petroleum, and electrical equipment industries. | |
| GA | +2,853 | Layoffs in the transportation equipment and textile industries. | |
| AL | +3,471 | Layoffs in the rubber/plastics industry. | |
| FL | +4,253 | Layoffs in the construction, trade, service, and manufacturing industries, and agriculture. | |
| MI | +5,661 | Layoffs in the automobile industry. | |
| CA | +6,003 | Layoffs in the service industry. | |
| OH | +7,217 | Layoffs in the automobile industry. |
So far so good on commercial credit. It's the blue line here that you care about:

Non-financial totals over the last few months have grown a bit.
I think Roubini is wrong, unless we screw up horribly, or ROW does. And as for ROW, India's wholesale inflation is beginning to creep down, and lower energy prices are helping somewhat.
The big ROW issue is Europe. Do the eastern European loans start defaulting at high rates? There is a load of trouble coming down the pike having to do with credit default swaps on commercial credit in Europe, commercial loans defaulting, and property value drops in some boom areas. How well that can be managed is the biggest question.
 MaxedOutMama
