 MaxedOutMama
Wednesday, July 15, 2009
Crude, Industrial Production & A Look At Ratios
Again no support for oil pricing - on a YoY basis this week's inventory report has gasoline inventories up 2.3% over last year's, and usage is almost the same as last year.
It appears that people drove less than expected over the weekend of the Fourth, because the four-week running total of gas supply dropped:
Inventories remain extremely high given the drop in usage to levels of a decade ago:
One thing that so startled me this week is that gasoline demand change YoY dropped from what it has been in the spring and early summer:
Industrial production also disappointed me. Today's report, covering June, gives US industrial production down 13.6% YoY. Utilities are down 3.9% over the year. Business equipment down 17.8%. Construction down 20.7%. Manufacturing down 15.5%. Capacity utilization dropped to 68.0%. Manufacturing capacity dropped to 64.6%. Yikes.
This St. Louis Fed graph doesn't include the latest month's figures, but it shows how unprecedented the drop has been:

June rail traffic was something of an improvement over the spring, but it was not an improvement over YTD figures, which is significant. If we were to enter any type of recovery, we should see YoY drops less than the YTD YoY drops:
One factor that really struck me in the June US retail report was that the weakness I had noticed in the drugstore traffic and pricing seemed to be showing up in the figures. On an SA basis 446 trends:
Because sales are so low, inventory liquidation is struggling to keep up:

We would seem to have a long way left to go. 1.35 is probably the magic number at which we can look for overall resupply needs beginning to exceed inventory clearing needs. At the wholesale level, the number we are looking for is 1.20:
Given the almost unbelievably low capacity utilization figures, I think construction spending is due to drop below 800 before stabilizing:

So I certainly can't project an increase in oil usage any time soon.
It appears that people drove less than expected over the weekend of the Fourth, because the four-week running total of gas supply dropped:
Total products supplied over the last four-week period has averaged about 18.4 million barrels per day, down by 6.1 percent compared to the similar period last year. Over the last four weeks, motor gasoline demand has averaged 9.1 million barrels per day, up by 0.6 percent from the same period last year. Distillate fuel demand has averaged about 3.3 million barrels per day over the last four weeks, down by 11.7 percent from the same period last year. Jet fuel demand is 12.3 percent lower over the last four weeks compared to the same four-week period last year.On a YTD YoY basis, product supply for domestic use has now dropped to -6.4%, and total net imports have dropped to -7.5%. I am a little startled by these figures. I had expected them to go the other way. It kind of looks to me like we are heading to crude prices around the $50 level, but there may not be a floor there, even with strong spec buying. Average import prices on the last month's report were $51 a barrel. We're going back lower than that.
Inventories remain extremely high given the drop in usage to levels of a decade ago:
U.S. commercial crude oil inventories (excluding those in the Strategic Petroleum Reserve) decreased by 2.8 million barrels from the previous week. At 344.5 million barrels, U.S. crude oil inventories are above the upper boundary of the average range for this time of year. Total motor gasoline inventories increased by 1.5 million barrels last week, and are in the upper half of the average range. Finished gasoline inventories fell last week while gasoline blending components increased during this same time. Distillate fuel inventories increased by 0.6 million barrels, and are above the upper boundary of the average range for this time of year. Propane/propylene inventories increased by 2.3 million barrels last week and are above the upper limit of the average range. Total commercial petroleum inventories increased by 1.5 million barrels last week, and are above the upper limit of the average range for this time of year.See the previous post discussing the BP Statistical Review. At that time YTD YoY net imports were down 5.8%. In this report they are listed as being down 7.5%. Believe me, this says nothing favorable for oil price expectations. Last year, US oil consumption dropped 6.4%. With just over half the year gone, we are exactly in line with that trend, suggesting about a 3-4% world demand drop. (I do not believe that every other country is maintaining demand! However, if you do, we are still looking at a US-induced two-year swing of -2.5% at least.)
One thing that so startled me this week is that gasoline demand change YoY dropped from what it has been in the spring and early summer:
Over the last four weeks, motor gasoline demand has averaged 9.1 million barrels per day, up by 0.6 percent from the same period last year.Last week it was up by 0.9 percent. I think this may be due to lower holiday usage. If not, it says something extraordinarily negative about the trajectory of the US economy over the rest of the year.
Industrial production also disappointed me. Today's report, covering June, gives US industrial production down 13.6% YoY. Utilities are down 3.9% over the year. Business equipment down 17.8%. Construction down 20.7%. Manufacturing down 15.5%. Capacity utilization dropped to 68.0%. Manufacturing capacity dropped to 64.6%. Yikes.
This St. Louis Fed graph doesn't include the latest month's figures, but it shows how unprecedented the drop has been:
June rail traffic was something of an improvement over the spring, but it was not an improvement over YTD figures, which is significant. If we were to enter any type of recovery, we should see YoY drops less than the YTD YoY drops:
The Association of American Railroads today reported that U.S. railroads originated 1,039,889 carloads of freight in June 2009, down 19.7 percent with 255,668 fewer carloads, compared with June 2008. U.S. intermodal rail traffic – comprising trailers and containers on flat cars that are not included in carload figures – totaled 755,000 units in June 2009, down 18.2 percent compared with the same period last year with 168,031 fewer trailers and containers.My expectations were modest, but were not met.
For the first six months of 2009, total U.S. rail carloadings were down 19.5 percent (1,594,411 carloads) to 6,579,294 carloads, while intermodal traffic was down 17.0 percent (950,147 units) to 4,647,068 trailers and containers.
One factor that really struck me in the June US retail report was that the weakness I had noticed in the drugstore traffic and pricing seemed to be showing up in the figures. On an SA basis 446 trends:
April: 21,05144611 (pharmacy & drugs) figures for June are not available yet, but sales dropped from 17,538 to 17,475 from April to May.
May: 21,036
June: 20,969
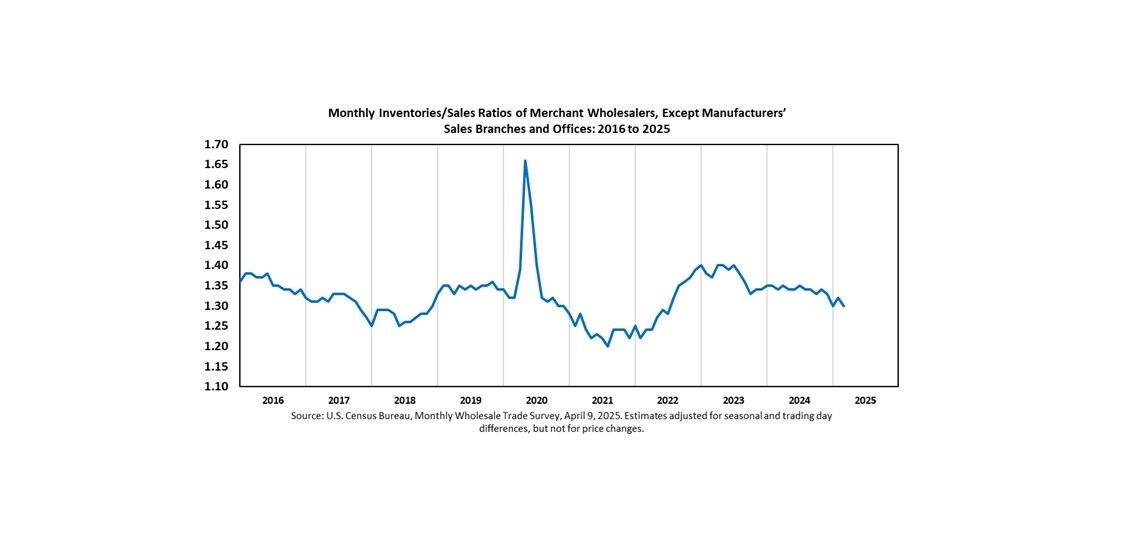
Because sales are so low, inventory liquidation is struggling to keep up:
We would seem to have a long way left to go. 1.35 is probably the magic number at which we can look for overall resupply needs beginning to exceed inventory clearing needs. At the wholesale level, the number we are looking for is 1.20:
Given the almost unbelievably low capacity utilization figures, I think construction spending is due to drop below 800 before stabilizing:
So I certainly can't project an increase in oil usage any time soon.
Comments:
<< Home
Would it be safe to say that until consumer debt is
reduced ,nothing is going to improve ? I don't see
the velocity of money until debt is cleared.
reduced ,nothing is going to improve ? I don't see
the velocity of money until debt is cleared.
# posted by  : 3:39 PM
: 3:39 PM
We're going to have to dump a bunch of debt, both corporate and personal.
It's very unfortunate that federal politics is such that any measures to help that along are being blocked.
I am reading credit card filings today. We should be close to the peak on CC chargeoffs based on comparisons to previous periods. I also wanted to get a fix on what those portfolios were doing - whether they were being paid down, oscillating sideways or what.

I'm puzzling through the disconnect between this data and the reaction to Intel's quarterly results that were released today. I haven't crawled through them, but it sounds as though the big bright spot for Intel was extremely rapid growth in low-end processors for netbooks, which are low-end PCs. To me this is an indicator that Intel is going to handily survive the next few years, but it doesn't speak to any sort of earnings growth.
Then again, maybe I'm wrong. The market sure came close to blowing a hole in my trading thesis today. A new high would really mean something.
Post a Comment
Then again, maybe I'm wrong. The market sure came close to blowing a hole in my trading thesis today. A new high would really mean something.
<< Home
![]()
