 MaxedOutMama
Monday, November 26, 2012
Just Recession Graphs of Various Types
The best first. You will find an explanation and links to papers at this link:

This approach has now been tested on two recessions since its intro in 1998. Oh, wait, make that three.... See the updated discussion here. The Chauvet-Piger method is strong and rapid. this summer we exceeded the lower bound, and now (October) it says we are in a recession. The interesting thing about this method is that it also "catches" the beginning of the 2006 industrial recession in the US, which few other indicators do.
The weakness of this method is that it catches the turning points, but it does so in real-time (six to nine months ahead of NBER), whereas one would like to have the Fed and gov get six month's warning so effective interventions were possible. But no, this doesn't do it.The bottom line here is that the Fed needed to do what it is doing now back in the spring to have any hope of fending this recession off. Readers of this blog may remember CF's comments early this year that the Fed would begin buying mortgage bonds in the spring. Haha. This is why CF has the jet and they don't. There's a theory out there that the Fed is going to launch a panic buying program of 80 (double) or so to try to deal with the situation. I don't think they can. I don't think there are enough bonds out there to support it.
CFNAI diffusion: CFNAI was released today. CFNAI also produces a diffusion index. You can find this graph in their release:
 Once the 3-month diffusion index reaches -0.35 we are in a recession. According to this one, not yet, but almost (-0.32). Negative diffusion trends once you've completed the first inventory cycle after a recession always have to be watched, though. It would be unlikely to reach a diffusion point this low at this point in the business cycle without a succeeding recession, and by unlikely, I mean it doesn't really happen. Strong monetary expansions (which must include introducing the money and ensuring that it circulates) can create considerable lift at this point, but how is that possible now?
One really interesting thing about CFNAI diffusion, which can generally be reproduced in other countries with reliable economic data (not China) is that in a bubble, you will usually see the first dip, a pop and then a second dip as lending compensates. I do not use this for forecasting, but I do think it catches something very real and fundamental about the US economy, which is that the forces which create recessions usually move into a play a year before the actual recession.
The Texas manufacturing survey, which was my "strong" region, was very disappointing this month. This is kind of a kick in the M_O_M confidence, because all my wonderful hopes for something mildish in the recession line kind of depend on trends that are centered in this region. The DC envelope is of course still extant, but it is supported by a flood of government money that is inevitably going to be slowly throttled down, so it's nothing you can rely on.
I try to predict recessions a year out. Freight is very helpful, but these indicators are as well for shape and timing:

Really I track changes in disposable income and M_O_M calculated changes in real money supply, but these three sets of data serve as a useful check on my own numbers. The utilities change over time will give me a helpful read on sensitivity to changes in real money supply. When utility usage is stagnant, the economy is weak and very sensitive to negative changes. The current period of stagnation has endured since 2007, and is similar only to the period from 78-83.
Producer prices and consumer prices give me timing info. They will take an initial fall when the economy is seizing up, and then increase as we go into the full recession onset. Recessions have different shapes, and the price spread for businesses is one of the determining factors. When businesses find themselves with compressing profit margins due to high costs and price sensitivity in sales, they have to cut their operating costs, which generates waves of negative diffusion across the economy. This shows up in personal income trends:

Here we have a rather busy graph showing utilities (to show the correlation), real retail and food services sales in green, real disposable personal income and real personal consumption expenditures, and then, in purple, the dire real personal income excluding current transfer receipts.
In detail, the same series displayed so that you can see them:

To this one I have added the previous retail series in blue. So jagged blue and green are retail sales. Red/orange are real personal disposable personal income and Personal consumption (which captures non-retail sales as well). Then, in the heavy purple line, we have real personal income excluding government benefits, i.e., income generated by the private economy.
Now real personal income doesn't account for tax changes - remember that.
So now we come into a mild recessionary period with these mechanics. I have included the history so that you can see that the massive gap which opened up between the purple (privately generated income) and the red (all personal income less taxes) didn't exist in the 79-83 protracted slump.
It's blindingly obvious that spending is now dependent on government transfers to people. Whereas real personal consumption is higher than it was entering the recession, private incomes have not recovered nearly to the same point - they are back to 2006 levels. Nor are we closing the gap very fast at this point, which means that our tax basis isn't improving very much.
The gap may be widening now, which is what one would expect in a mild recession combined with a wave of retirements.
We are running a massive structural deficit:

Not surprisingly, this has generated a massive rise in issued federal government debt:

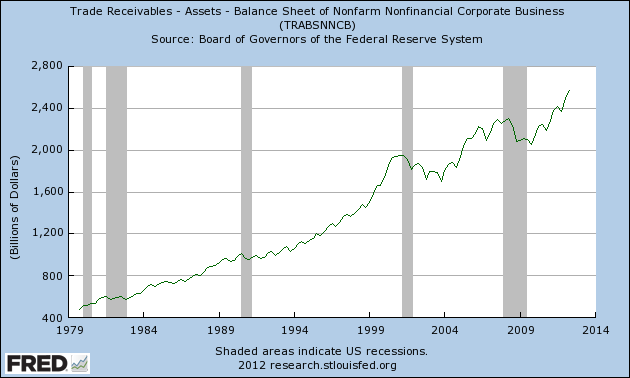
Company profits cannot be taxed at any levels that could remotely remedy the situation:


The first graph shows net worths - and note that on a market basis, net worths of nonfinancial corporations has not recovered to the pre-recession basis, much less grown. The bottom line - flow - trade receivables - shows that businesses are now growing, but with receivables at about 2.6 trillion, it is pretty obvious that you are not going to close a trillion dollar deficit by taxing corporate profits.
Furthermore, companies are borrowing to finance the growth you see:

So don't expect them not to be very responsive to tightening profits. They'll economize quickly, and they are sensitive to spreads of all kinds.
If you raise personal taxes a lot, you cut the purple line (income generated by the private economy), which may make things worse. Therefore, the problem is not really the recession we've got. It's the structural imbalance in the economy.
Also, we have reached the tipping point on pension funds between private and governmental. This will have future repercussions because it says a lot about the ability to generate growth by savings.
This approach has now been tested on two recessions since its intro in 1998. Oh, wait, make that three.... See the updated discussion here. The Chauvet-Piger method is strong and rapid. this summer we exceeded the lower bound, and now (October) it says we are in a recession. The interesting thing about this method is that it also "catches" the beginning of the 2006 industrial recession in the US, which few other indicators do.
The weakness of this method is that it catches the turning points, but it does so in real-time (six to nine months ahead of NBER), whereas one would like to have the Fed and gov get six month's warning so effective interventions were possible. But no, this doesn't do it.The bottom line here is that the Fed needed to do what it is doing now back in the spring to have any hope of fending this recession off. Readers of this blog may remember CF's comments early this year that the Fed would begin buying mortgage bonds in the spring. Haha. This is why CF has the jet and they don't. There's a theory out there that the Fed is going to launch a panic buying program of 80 (double) or so to try to deal with the situation. I don't think they can. I don't think there are enough bonds out there to support it.
CFNAI diffusion: CFNAI was released today. CFNAI also produces a diffusion index. You can find this graph in their release:

One really interesting thing about CFNAI diffusion, which can generally be reproduced in other countries with reliable economic data (not China) is that in a bubble, you will usually see the first dip, a pop and then a second dip as lending compensates. I do not use this for forecasting, but I do think it catches something very real and fundamental about the US economy, which is that the forces which create recessions usually move into a play a year before the actual recession.
The Texas manufacturing survey, which was my "strong" region, was very disappointing this month. This is kind of a kick in the M_O_M confidence, because all my wonderful hopes for something mildish in the recession line kind of depend on trends that are centered in this region. The DC envelope is of course still extant, but it is supported by a flood of government money that is inevitably going to be slowly throttled down, so it's nothing you can rely on.
I try to predict recessions a year out. Freight is very helpful, but these indicators are as well for shape and timing:

Really I track changes in disposable income and M_O_M calculated changes in real money supply, but these three sets of data serve as a useful check on my own numbers. The utilities change over time will give me a helpful read on sensitivity to changes in real money supply. When utility usage is stagnant, the economy is weak and very sensitive to negative changes. The current period of stagnation has endured since 2007, and is similar only to the period from 78-83.
Producer prices and consumer prices give me timing info. They will take an initial fall when the economy is seizing up, and then increase as we go into the full recession onset. Recessions have different shapes, and the price spread for businesses is one of the determining factors. When businesses find themselves with compressing profit margins due to high costs and price sensitivity in sales, they have to cut their operating costs, which generates waves of negative diffusion across the economy. This shows up in personal income trends:

Here we have a rather busy graph showing utilities (to show the correlation), real retail and food services sales in green, real disposable personal income and real personal consumption expenditures, and then, in purple, the dire real personal income excluding current transfer receipts.
In detail, the same series displayed so that you can see them:

To this one I have added the previous retail series in blue. So jagged blue and green are retail sales. Red/orange are real personal disposable personal income and Personal consumption (which captures non-retail sales as well). Then, in the heavy purple line, we have real personal income excluding government benefits, i.e., income generated by the private economy.
Now real personal income doesn't account for tax changes - remember that.
So now we come into a mild recessionary period with these mechanics. I have included the history so that you can see that the massive gap which opened up between the purple (privately generated income) and the red (all personal income less taxes) didn't exist in the 79-83 protracted slump.
It's blindingly obvious that spending is now dependent on government transfers to people. Whereas real personal consumption is higher than it was entering the recession, private incomes have not recovered nearly to the same point - they are back to 2006 levels. Nor are we closing the gap very fast at this point, which means that our tax basis isn't improving very much.
The gap may be widening now, which is what one would expect in a mild recession combined with a wave of retirements.
We are running a massive structural deficit:
Not surprisingly, this has generated a massive rise in issued federal government debt:
Company profits cannot be taxed at any levels that could remotely remedy the situation:

The first graph shows net worths - and note that on a market basis, net worths of nonfinancial corporations has not recovered to the pre-recession basis, much less grown. The bottom line - flow - trade receivables - shows that businesses are now growing, but with receivables at about 2.6 trillion, it is pretty obvious that you are not going to close a trillion dollar deficit by taxing corporate profits.
Furthermore, companies are borrowing to finance the growth you see:
So don't expect them not to be very responsive to tightening profits. They'll economize quickly, and they are sensitive to spreads of all kinds.
If you raise personal taxes a lot, you cut the purple line (income generated by the private economy), which may make things worse. Therefore, the problem is not really the recession we've got. It's the structural imbalance in the economy.
Also, we have reached the tipping point on pension funds between private and governmental. This will have future repercussions because it says a lot about the ability to generate growth by savings.
Comments:
By the way, I had no idea that MMT comes from "Chartalism", yet another tautological philosophy which arose during the Victorian era.
<< Home
There's a word that describes an economic decline and inability to reach previous levels. Give me a bit... Nope, I just cannot remember. ;)

M_O_M sez:
There's a theory out there that the Fed is going to launch a panic buying program...I don't think there are enough bonds out there to support it.
It's blindingly obvious that spending is now dependent on government transfers to people.
The DC envelope...is supported by a flood of government money that is inevitably going to be slowly throttled down....
Methinks those last two statements are going to be seen as the solution to the first. Want to boost consumption? No problemo! Have the Fed print money to cover entitlement transfers, and heck, why not cover state employee pension payouts as well? Bingo, you've gotten the deficit under control and prevented a recession all at one go. That would also fit with the focus on taxation of the "wealthy"--when the Administration starts passing out funny money to the financial sector, they'll need an anti-wealth policy in their pocket to insulate them from claims of favoring their rich buddies.
And the medium-term negative effects of these policies can be ignored until after the midterm elections...
By the way, I had no idea that MMT comes from "Chartalism", yet another tautological philosophy which arose during the Victorian era.
supported by a flood of government money that is inevitably going to be slowly throttled down
Ah, MoM, ever the optimist. Do leeches ever "slowly throttle down" out of concern for their host?
---
Someone wrote an article the other day about how scrapping the debt ceiling could just be the ticket for waking up the bond vigilantes. If so, sign me up.
Ah, MoM, ever the optimist. Do leeches ever "slowly throttle down" out of concern for their host?
---
Someone wrote an article the other day about how scrapping the debt ceiling could just be the ticket for waking up the bond vigilantes. If so, sign me up.
Laurdagsbarnetimen, a Norwegian children show, with its premiere in 1924 is still being broadcast weekly, which makes it the longest running radio show in the world.
informative post
Post a Comment
informative post
# posted by  : 9:49 PM
: 9:49 PM << Home
![]()
