 MaxedOutMama
Friday, May 15, 2015
The Real World Effect Of That Big Flaming Ball Of Gas In The Sky
Secondary to my previous post, here's the joy of it all.
Industrial production was released today. Here's the result:

IP has been working down a bit for months. The blue line is the index, the red line is the YoY. The green line is real retail YoY. We're not QUITE in a recession yet, and hopefully we won't get there, but the reason we are not was the giveback on the gas. That gave consumers enough back to get them through another bad winter with more margin. But we are right on the line. I expect IP to rebound slightly in May - the latest report is
Rail confirms this but may be giving my May rebound theory the raspberry:

That blue line is just failing to green shoot, and this goes through May 9th. Rail was hard to read this year, because of course the port strike slowed things, and then there was a rebound, so one had to just sit and wait for all of that to work itself out of the system to confirm a trend.
Now, I still believe there is the economic space to get out of this without recession. Nor am I surprised, because honestly the direction of CMI does show tightness. But it is not the time to be loading the economy down with ANY more regulatory mandates, and ACA changes have truly had a very adverse effect on many families. Consumer Units.
This is all quite dire for China, which usually gets a May uplift from the US retail cycle, and may not get that much of one this year. China's economy looks really weak.
A close-up on that mug shot:
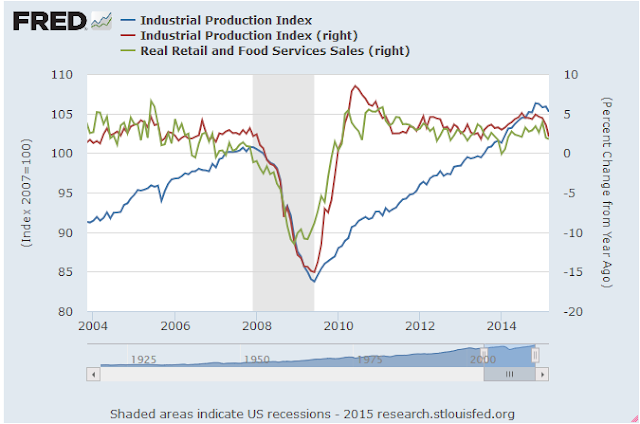 The red, graphed on the right scale, is IP YoY. The green real retail YoY.
I was trying to find the reason for the real stresses seen in NACM CMI, and one of the things I came up with is the sharply increased electricity costs for some regions, combined with a bad winter.
In any case, if we want to scrape through this "soft" patch, we are going to have to do it ourselves. The only government policy that is helping at all this year is the drop in FHA premiums.
Industrial production was released today. Here's the result:

IP has been working down a bit for months. The blue line is the index, the red line is the YoY. The green line is real retail YoY. We're not QUITE in a recession yet, and hopefully we won't get there, but the reason we are not was the giveback on the gas. That gave consumers enough back to get them through another bad winter with more margin. But we are right on the line. I expect IP to rebound slightly in May - the latest report is
Rail confirms this but may be giving my May rebound theory the raspberry:
For the first 18 weeks of 2015, U.S. railroads reported cumulative volume of 5,043,559 carloads, down 1.8 percent from the same point last year; and 4,679,513 intermodal units, up 1.7 percent from last year. Total combined U.S. traffic for the first 18 weeks of 2015 was 9,723,072 carloads and intermodal units, a decrease of 0.1 percent compared to last year.Here's the graph - we've been weakening recently:

That blue line is just failing to green shoot, and this goes through May 9th. Rail was hard to read this year, because of course the port strike slowed things, and then there was a rebound, so one had to just sit and wait for all of that to work itself out of the system to confirm a trend.
Now, I still believe there is the economic space to get out of this without recession. Nor am I surprised, because honestly the direction of CMI does show tightness. But it is not the time to be loading the economy down with ANY more regulatory mandates, and ACA changes have truly had a very adverse effect on many families. Consumer Units.
This is all quite dire for China, which usually gets a May uplift from the US retail cycle, and may not get that much of one this year. China's economy looks really weak.
A close-up on that mug shot:

I was trying to find the reason for the real stresses seen in NACM CMI, and one of the things I came up with is the sharply increased electricity costs for some regions, combined with a bad winter.
In any case, if we want to scrape through this "soft" patch, we are going to have to do it ourselves. The only government policy that is helping at all this year is the drop in FHA premiums.
Comments:
Well then, consider buying a battery pack capable of running your heat pump for a few hours during a brownout.
Elon Musk has very good timing, although you can do the same thing with plain old deep-cycle batteries.
<< Home

Well then, consider buying a battery pack capable of running your heat pump for a few hours during a brownout.
Elon Musk has very good timing, although you can do the same thing with plain old deep-cycle batteries.
Or try setting up solar to power a part of the house (assuming you have enough sun to be worth it.) I have transitioned over to treadle sewing machines so I am ready!!
MOM, I noted that the questions about credit availability in the NFIB didn't seem to track the credit manager's index. My theory is that the credit stress was focused in energy dependent sectors and regions where the change in activity has been whiplash inducing.
CMI seems to be bottoming along with the rig count. That's my theory, not sure if there is any more granular data to support or refute that.
CMI seems to be bottoming along with the rig count. That's my theory, not sure if there is any more granular data to support or refute that.
# posted by  : 11:20 AM
: 11:20 AM
Brian, I literally think it was just a bad case of winter.
I expected housing to take a big pick up by March - now in April it has. There's just a lag going on.
Still I think consumers are laying by, but real inflation for less-well-off consumers has been far higher than headline inflation, so it makes sense.
Post a Comment
I expected housing to take a big pick up by March - now in April it has. There's just a lag going on.
Still I think consumers are laying by, but real inflation for less-well-off consumers has been far higher than headline inflation, so it makes sense.
<< Home
![]()
