 MaxedOutMama
Friday, April 30, 2010
Pretty Good Chicago PMI
Here.
The two things I wanted to see in this one were inventories (about static, which means we are not outrunning yet), and employment, which rose from 53.1 to 57.2.
Manufacturing employment losses in this recession were awe-inspiring. The following graph is from BLS' last Monthly Labor Review:

Back to the levels of the 1940s. Until manufacturing employment recovers somewhat, this is all going to be on shaky ground.
US economic trends are difficult largely because of this drop. We ought to be following extremely manufacturing-friendly policies, but we are not.
Q1 GDP came in at 3.2% annualized, but mostly on PCE growth, which is outrunning real disposable income growth by any standards.
So the theme remains. It's demographics, income, and a whole load of bad debt.
State and local government spending fell 3.8% in the first quarter. Because the surge in federal spending is wearing itself out, total government spending fell 1.8%. From Table 3 we see that Gross Private Domestic Investment rose 56.8 billion, but 50.8 billion of that was inventory build. PCE rose 83.2 billion, or 3.6%, but real disposable personal incomes, according to BEA, were unchanged. Expenditures on durable goods increased 11.3%, and were a big factor in PCE growth.
So, basically we've all got to spend, spend, spend to keep this going. It would be nice if more people had money to spend. There is still probably some backed-up demand for the third of the population that has money, but as one of them, I can tell you there are limits on my willingness to spend on anything except other people in deep trouble. There are so many of them I know that I am unwilling to go buy a new car. I'm thinking that I need to have the money by to make sure that everybody eats and gets medicine!
You can see why I am so worried about prices and the expiration of unemployment benefits. In 2011 taxes will rise, and of state and local taxes (plus service fees) are still rising.
It will be interesting to see European Q1 figures. Europe is a pretty big trading partner for the US. Growth there would help us.
So trying to maintain growth for another four quarters is going to be a careful balancing act, at best. Percentage-wise, Gross Private Domestic Investment rose 14.8% in Q1 compared to rising 46.1% in Q4. Again, most of this quarter's rise was still inventory build. This is going to start fading out, and I don't expect much help from structures other than public-works programs. Since Gross Private Domestic Investment is the fundamental driver, most economists will be a bit worried for the next two quarters.
If small businesses were not so depressed, I'd be thinking we'd get more out of equipment and software. But I do use NFIB for that portion, and so far this year reading the NFIB survey has been an exercise in character building. I'm hoping that profit rebounds in larger companies combined with restrained spending over the last few years will funnel more into the equipment and software portion of GPDI.
Also see CR's comments, which address the same issue.
Thursday, April 29, 2010
Initial Claims
Not too bad. This week's headline number is 448,000; the four week MA is 462,500.
The worry here is about money circulation; job production is slim and more state and local jobs will be cut this year. With new job creation constrained, we would like to see job losses slowing.
Anyway, I updated the three recessions claims graph:

Click on this one to open it up in another window or tab if you want a larger version.
The green line is 1980, which obviously transitioned into the second dip.
The situation is equivocal. It seems to be a race against time to generate enough economic activity to carry us through into longer term growth.
People are now falling off the employment extensions at a pretty fast clip, and that's not going to help. Census hiring should peak this summer and then start to fall off pretty rapidly. Census hiring is picking up some slack here.
Another potentially helpful factor is that more people who are working may be getting raises this year, which would certainly improve their ability and willingness to spend!
An afterthought:
BLS publishes a monthly labor review that is often helpful, which can be found here. Of course the information is usually 3-4 months out of date. Anyway, from this article in their latest edition:

This only goes through December.
This Morning's Italian Bond Auction
Went very well.
However the panic has boosted talk about the Greek crisis into high gear, with much higher numbers over a period of years under discussion, and a promise of action within days.
Yesterday's crude inventories report showed higher stocks and much greater refinery utilization. YoY to date products supplied are up 0.8%. Comparing the last four weeks to the same period in 2009, gasoline supplied is up 3.2%. This is pretty good, economically speaking.
The economy in Europe is generally improving too. However there are some concerns as the game of "Bonds, bonds, who's got the bonds?" launches:
I still do not see how the Greek problem can be resolved without a 25% haircut for creditors. I suppose that could come from governments, but it has to come from somewhere in order to get Greece in solvent territory. 30% would be much safer, but Greece would still be subprime for a year or two at best.
However the panic has boosted talk about the Greek crisis into high gear, with much higher numbers over a period of years under discussion, and a promise of action within days.
Yesterday's crude inventories report showed higher stocks and much greater refinery utilization. YoY to date products supplied are up 0.8%. Comparing the last four weeks to the same period in 2009, gasoline supplied is up 3.2%. This is pretty good, economically speaking.
The economy in Europe is generally improving too. However there are some concerns as the game of "Bonds, bonds, who's got the bonds?" launches:
S&P cut Greece by three steps on April 27 to BB+, the highest non- investment grade, and said investors may recover as little as 30 percent of their initial outlays should the country reorganize its debt. It lowered Portugal two steps to A- the same day. It cut Spain one level to AA yesterday.The ECB is supposed to have collateral in investment grades, so the last downgrade kind of puts them in a tough spot. Spain's unemployment level has been unofficially reported over 20% in the first quarter of this year.
French banks have the biggest exposure to Greece among European lenders, accounting for $78.8 billion of the $193.1 billion of total claims European banks have on Greece, according to the Bank for International Settlements. They also have the second-largest claims on Portugal and Spain, after German banks, and are the biggest holders of Italian debt, BIS figures show.
I still do not see how the Greek problem can be resolved without a 25% haircut for creditors. I suppose that could come from governments, but it has to come from somewhere in order to get Greece in solvent territory. 30% would be much safer, but Greece would still be subprime for a year or two at best.
Wednesday, April 28, 2010
Let The Games Begin!!
I don't know if any of you have been following the Euro debacle, but it started as a debt slide and is turning into a debt avalanche. Every day the news gets worse. Bloomberg:
Germany is looking like the bad guy here, but is that fair? If the real problem is the sovereign debt in multiple nations, Germany cannot bail them all out.
The panic and rising swap rates for various banks is correlated with new worries about Italy:
The reason is Italy's public debt. When your government debt/GDP ratio is above 100%, any increase in financing costs is pretty catastrophic. And Italy is the lynch pin here; Portugal, Ireland and Spain are too small to really matter. But Italy does matter, and Italy is going to have to work on its own debt now.
Germany certainly can't bail out Italy, and I suspect mobs would hit the streets in Germany if they tried. Germany's ex-Euro exports will be assisted by a weaker Euro, but Germany's intra-Euro exports are likely to be hurt by a wave of government austerity hitting several European nations. And then there is the banking issue, because no one knows how the banks will ride this out.
As for the US, we should take heed and change course while we still can. Europe is in the first stage of a major banking and government finance crisis, and in the end services to its own citizens will be deeply impacted. Neither Republicans nor Democrats have any excuse for ignoring our future if we continue on our present course, and Europe is showing us our future.
PS: Germany's future is impacted by the future of the eastern Soviet escapee bloc, and those countries will be impacted for several years to come, as the Czech move shows.
I note that Bernanke is abruptly stepping up his calls for fiscal soundness. Everyone knows what we are facing.
A note: This roundup of developments and statements is a nice summary. Trying to stem the havoc by announcing that Greek debt won't be "restructured" is pretty clueless; it just means that the governments and the IMF have to give Greece more money. And since the problem isn't just Greece, this amounts to plugging in some air freshener to mask the scent of the dung of the bull elephant thrashing around your living room.
Europe’s worsening debt crisis is intensifying pressure on policy makers to widen a bailout package beyond Greece after a cut in the nation’s rating to junk drove up borrowing costs from Italy to Portugal and Ireland. ...What is really happening here is that all the risks are correlating. I don't have too much to say about this. European banks are becoming more risky by the moment. The truth is that the concerns over debt of various European nations are well founded. Yields for Greek mid-term bonds have gone to junk levels. But any bailout that doesn't clear quite a bit of Greece's debt is probably going to fail; the effect of cutting so much from government spending and raising taxes will put Greece in a longer, deeper slump, which will cut tax receipts, which will make it harder to balance their government budget.
The danger for European officials is that the fiscal turmoil which started six months ago with fudged Greek budget data will spin out of their control. As Greece waits for its euro-region partners to disburse funds, the European Union has announced no concrete plans to help other nations should aid be needed.
Germany is looking like the bad guy here, but is that fair? If the real problem is the sovereign debt in multiple nations, Germany cannot bail them all out.
The panic and rising swap rates for various banks is correlated with new worries about Italy:
Italy sold EUR9.5 billion in six-month Treasury bills Tuesday. But the Treasury received only EUR9.78 billion in bids, offering a razor-thin margin compared with previous debt sales. Moreover, the average yield jumped to 0.814%, much higher than analysts expected and far above the 0.567% yield offered at last month's auction of the same paper.I wouldn't call this "mood". I'd call it the dawning recognition of reality. Compare to Germany's six-month yields, currently around 0.33%, or those of the US, which have been averaging 0.24% this month.
Italy's coming auction of up to EUR8 billion in three types of government bonds Thursday will now be closely scrutinized for further signs of contagion.
While paling next to the dramatic yield swings in Greece or Portugal, both of which had their ratings downgraded late Tuesday, the shift in mood is undeniable.
The reason is Italy's public debt. When your government debt/GDP ratio is above 100%, any increase in financing costs is pretty catastrophic. And Italy is the lynch pin here; Portugal, Ireland and Spain are too small to really matter. But Italy does matter, and Italy is going to have to work on its own debt now.
Germany certainly can't bail out Italy, and I suspect mobs would hit the streets in Germany if they tried. Germany's ex-Euro exports will be assisted by a weaker Euro, but Germany's intra-Euro exports are likely to be hurt by a wave of government austerity hitting several European nations. And then there is the banking issue, because no one knows how the banks will ride this out.
As for the US, we should take heed and change course while we still can. Europe is in the first stage of a major banking and government finance crisis, and in the end services to its own citizens will be deeply impacted. Neither Republicans nor Democrats have any excuse for ignoring our future if we continue on our present course, and Europe is showing us our future.
PS: Germany's future is impacted by the future of the eastern Soviet escapee bloc, and those countries will be impacted for several years to come, as the Czech move shows.
I note that Bernanke is abruptly stepping up his calls for fiscal soundness. Everyone knows what we are facing.
A note: This roundup of developments and statements is a nice summary. Trying to stem the havoc by announcing that Greek debt won't be "restructured" is pretty clueless; it just means that the governments and the IMF have to give Greece more money. And since the problem isn't just Greece, this amounts to plugging in some air freshener to mask the scent of the dung of the bull elephant thrashing around your living room.
Monday, April 26, 2010
She Is Up And At 'Em
Thanks. Some people don't believe in prayer, but in my experience it works as long as the prayer and the action are in sync. You can't ask for one thing and behave a different way. That's not prayer - that's pretense.
She is up! Early this afternoon she had already put in a few hours of housework and snorked down several highly creditable meals. She's looking almost her old self.
The lady has one heck of an immune system. This is almost certainly the virus that had Stagflationary Mark testing his theory that the proper treatment for a persistent lung infection is more exercise, so under the circumstances she is turning in a remarkable performance. I did hint at a nap today, but she stared me down. Fortunately she does not have a treadmill at her house, because I do not think the exercise cure will work any better for her than Mark. Movement yes, exercise, no.
Saturday night she started to throw a highly respectable fever, and I just let it rip as long as she could stay hydrated. Sunday it slowly diminished, and yesterday afternoon she got up and washed her hair. Today she had cleaned out the refrigerator, done some laundry, washed dishes, moved some plants out to get the rain, etc. She is eating well now. Last night her blood sugar was 155, and I bet she'll be almost in range today.
Blogging will resume tomorrow or Wednesday; I have been putting in a lot of time with this, I will still be visiting with her for at least an hour a day, and I have chores backed up.
Saturday, April 24, 2010
She's Pulling Out
It's gonna be a few difficult more days, but today she stayed off the Klondike bars and her sugars are stabilizing, she is drinking and eating more, and her lungs are beginning to clear.
Thanks for the help. It's a difficult position.
Thanks for the help. It's a difficult position.
Friday, April 23, 2010
Sigh
Look, I'm sorry, but Klondike bars are really impeding my blogging. I just don't know how this is going to go.
The Chief is now pretty stable, and just when I thought I would get my life under control, I am having troubles with my mother's old neighbor again.
She is going to be 90 in June, and she is under treatment for walking pneumonia. Well, I've been checking up on her, and I didn't like the way she looked this morning, so I tested her blood sugar. 143. I made sure she ate and gave her a lecture (no more breakfasts consisting of a doughnut). When I called, she had told me she had toast, but after testing her blood sugar the doughnut confession emerged.
I went back tonight, and lo and behold, 199. Upon which result she confessed to a Klondike bar (whereas before dinner was reported as a cheese and tomato sandwich). Not that this was what I had agreed with her she would eat for dinner anyway. She was supposed to have vegetables, the chicken breast I took over, and maybe a little turkey gravy if she really had to, plus one slice of whole wheat.
So I have been sitting over there arguing with her. If she wants to stay in the house the sweets have got to go. I wanted to take her in tonight, but she argued desperately against it. Needless to say, I will be over there tomorrow morning again first thing. I probably will end up taking her to the doctor then. Also SuperDoc called me about his home computer today, and I have to go in to his office tomorrow to do the weekly backups.
I am between the devil and the deep blue sea on this one, because if I tell family they will bing her into a home and she will never get out. The family situation is really bad. But I cannot let this go on. Her mind is quite clear - in fact, she's way sharper than she was a few years ago. She is competent,, and indeed extremely strong-willed. But she clearly should not be living alone any more. Her husband died in 2005. Her brother, who was living with her, died about 14 months ago. She does have someone who comes by most days and takes her around, but now she needs a little more care.
I HAVE kinda sorta got a financing arrangement worked out where she could afford to get a live-in caretaker which is what she needs. The house probably won't qualify for a reverse mortgage, because the septic system isn't going to pass and the water probably won't either. But I got someone who will buy it on installment with the agreement that she can live there for the rest of her life. However she is not quite willing to do that - yet.
If I can get her stable I can probably get her to a situation in which she'll be protected but not incarcerated. The family just wants the money. But it may take some doing, and in the meantime I feel nothing but guilt and responsibility. I could use some prayers on this one.
Thursday, April 22, 2010
The Quickie
Okay, I am so busy I am way short on sleep (spring yardwork added to everything else), but....
Initial Unemployment Claims:
This week's headline number (SA) is 456,000. The four-week moving average is 460,250. That's pretty high! Last week's big number apparently stemmed mostly from:
The NY numbers staggered me a bit. The entire list (use the link above and scroll to the bottom) is worth a look. Two states reported finance layoffs (AZ & TX). The usual transportation, services & manufacturing dominated the list.
EUC (extended continued claims) dropped 508,000 last week. That is a huge number, and it reflects the expiration of the emergency one-month extension in the first week of April. Don't look for this to help the economy! There are not jobs of any sort out there for many of these people. Congress is debating the new employment benefits program - from what I have read the hold up is paying for it. Well, they should pay for it - there is plenty that can be cut in the federal budget. But they should also do this ASAP, because this isn't going to help us, nor will it really save that much money. Many of these people will just move to food stamps, etc. Unfortunately, some will qualify for virtually no further assistance (the details depend a great deal on states). This is no joke; some of these will be homeless, jobless and penniless.
If you are wondering (and anyone with a brain should be) about those claim numbers, here is one reason: The March Producer Price Index (PPI) is out today. Our 12 month from Table A (SA):
To have a persistent recovery we need money circulating through the hands of consumers! The other side of all this shows up in H.8 (Bank Assets and Liabilities). Total credit dropped 6.4% in 2009, and 6.6% in Q1 of 2010. Loans and Leases dropped a staggering 10.2% in 2009, and 10.1% in Q1 of 2010.
Okay, okay, we are now a cash economy. Returns are so low that it makes little sense to borrow for most purposes.
So how's the cash-building going? Here is the sign of the gathering storm in H.8 Other Deposits: In 2008 and 2009 Other Deposits grew at a pace of 8.9% and 8.8% respectively. The quarterly trajectory from the last quarter of 2008:
A lot of the growth potential in 2008 and 2009 came from debt defaults. Try living rent and mortgage free for six months to a year - you'll have more money left over! But now that is fading as banks move in to foreclose on more of these homes, but the lower wages and salaries are still there. The toss-the-house-pay-the-CCs movement also helped the CC debt for a while, but that too will be fading - total credit card chargeoffs this year will remain very high.
Not everyone in the US is "banked" as we call it in the industry. From 20-30% of the population is "unbanked". They tend to be a much poorer segment of the population and have been hit hard in this recession due to disproportionate job losses. Thus their situations are net likely to be worse than the banked population..
Thus we can conclude that without borrowing, the ability to spend is going to be constrained by the growth in money flowing into the consumers' hands, and growth in Other Deposits is a good proxy for that. Other deposits even picks up a lot of welfare/government transfer benefits, as most are now done straight to bank accounts.
So don't expect consumer spending to lend huge impetus to the rest of this recovery. That has to wait. It seems likely that consumers overspent a bit out of necessity in Q1. In Q2 they will be helped by lower fuel bills due to spring weather. By Q3 that will mostly be gone, the Census jobs will be fading, and I am thinking that even more people will be both without a job AND without unemployment benefits.
So, to sum this up, the reason why we are seeing the compression in trade margins is that consumers don't have that much money to spend. Once you go cash, you end up budgeting almost on a yearly basis for heating/cooling/medical and the like, and consumers are lopping discretionary spending to fund forced spending.
The potential offset here are the financial conservatives. They have money if they still have jobs. But the issue with financial conservatives is that they are frugal - and they will probably spend it for needs, such as when they really need a new car - but they are not going to redo the kitchen on a whim. They have money because they spend less than their income. That is a habit and a discipline, and if (as many are experiencing) they see their monthly expenses veering closer to their monthly income, they tend to cut back on monthly expenses.
Realistically, one big issue is the age of heads of households. The consumer expenditures survey shows average reference person ages. Let's look at ages of the reference person by quintile of income from 2008 (the latest available):
I do not expect US consumer spending to return to the free and easy days of the last two decades in the next two decades. I don't think that CC-funded spending will return to recent norms in the next two decades. I think we will stabilize at a very different mindset. It makes no sense to borrow money at 8% when your returns are much less than that, and financial stability for the average household is acutely dependent on the ability to save. The younger crowd will find that they will have to save money to buy a home or a car. Some cash on the table will become a necessity.
Over time, the return to some fiscal sense will fuel a future growth, but it is not going to fuel much net growth in the next few years.
Initial Unemployment Claims:
This week's headline number (SA) is 456,000. The four-week moving average is 460,250. That's pretty high! Last week's big number apparently stemmed mostly from:
CA | +23,785 |
| Return to a five day workweek, as well as layoffs in the service industry. |
NY | +23,876 |
| Layoffs in the transportation and service industries. |
The NY numbers staggered me a bit. The entire list (use the link above and scroll to the bottom) is worth a look. Two states reported finance layoffs (AZ & TX). The usual transportation, services & manufacturing dominated the list.
EUC (extended continued claims) dropped 508,000 last week. That is a huge number, and it reflects the expiration of the emergency one-month extension in the first week of April. Don't look for this to help the economy! There are not jobs of any sort out there for many of these people. Congress is debating the new employment benefits program - from what I have read the hold up is paying for it. Well, they should pay for it - there is plenty that can be cut in the federal budget. But they should also do this ASAP, because this isn't going to help us, nor will it really save that much money. Many of these people will just move to food stamps, etc. Unfortunately, some will qualify for virtually no further assistance (the details depend a great deal on states). This is no joke; some of these will be homeless, jobless and penniless.
If you are wondering (and anyone with a brain should be) about those claim numbers, here is one reason: The March Producer Price Index (PPI) is out today. Our 12 month from Table A (SA):
Crude: +3.2%Looking at the 12-month % change in Crude and Intermediate Goods broken down from Table B for the last three months (unadjusted):
Intermediate: +0.6%
Finished: +6.0% (unadjusted)
All Crude:Read through the CPI report for March. The all-items unadjusted 12 month % change for CPI-U in March was +2.4%. The compression squeeze is on, and when this persists you really see it over time due to the manufacturing profit effects. Basically, the companies cut costs to compensate for declining margins. What else can you do? But over time, the result is lower investment and corporate spending, tight wages, etc. And this feeds back through the rest of the economy.
Jan: +25.2%
Feb: +28.6%
Mar: +33.4%
All Intermediate:
Jan: +4.6%
Feb: +5.6%
Mar: +7.7%
To have a persistent recovery we need money circulating through the hands of consumers! The other side of all this shows up in H.8 (Bank Assets and Liabilities). Total credit dropped 6.4% in 2009, and 6.6% in Q1 of 2010. Loans and Leases dropped a staggering 10.2% in 2009, and 10.1% in Q1 of 2010.
Okay, okay, we are now a cash economy. Returns are so low that it makes little sense to borrow for most purposes.
So how's the cash-building going? Here is the sign of the gathering storm in H.8 Other Deposits: In 2008 and 2009 Other Deposits grew at a pace of 8.9% and 8.8% respectively. The quarterly trajectory from the last quarter of 2008:
Q4 08: 19.0%If it had not been for tax refunds, which really boosted February 2010 (+6.9%) Q1 would have been worse. This is where the 9.4% YoY drop in total wages and salaries starts showing up.
Q1 09: 14.2%
Q2 09: 8.2%
Q3 09: 5.1%
Q4 09: 6.7%
Q1 10: 2.6%
A lot of the growth potential in 2008 and 2009 came from debt defaults. Try living rent and mortgage free for six months to a year - you'll have more money left over! But now that is fading as banks move in to foreclose on more of these homes, but the lower wages and salaries are still there. The toss-the-house-pay-the-CCs movement also helped the CC debt for a while, but that too will be fading - total credit card chargeoffs this year will remain very high.
Not everyone in the US is "banked" as we call it in the industry. From 20-30% of the population is "unbanked". They tend to be a much poorer segment of the population and have been hit hard in this recession due to disproportionate job losses. Thus their situations are net likely to be worse than the banked population..
Thus we can conclude that without borrowing, the ability to spend is going to be constrained by the growth in money flowing into the consumers' hands, and growth in Other Deposits is a good proxy for that. Other deposits even picks up a lot of welfare/government transfer benefits, as most are now done straight to bank accounts.
So don't expect consumer spending to lend huge impetus to the rest of this recovery. That has to wait. It seems likely that consumers overspent a bit out of necessity in Q1. In Q2 they will be helped by lower fuel bills due to spring weather. By Q3 that will mostly be gone, the Census jobs will be fading, and I am thinking that even more people will be both without a job AND without unemployment benefits.
So, to sum this up, the reason why we are seeing the compression in trade margins is that consumers don't have that much money to spend. Once you go cash, you end up budgeting almost on a yearly basis for heating/cooling/medical and the like, and consumers are lopping discretionary spending to fund forced spending.
The potential offset here are the financial conservatives. They have money if they still have jobs. But the issue with financial conservatives is that they are frugal - and they will probably spend it for needs, such as when they really need a new car - but they are not going to redo the kitchen on a whim. They have money because they spend less than their income. That is a habit and a discipline, and if (as many are experiencing) they see their monthly expenses veering closer to their monthly income, they tend to cut back on monthly expenses.
Realistically, one big issue is the age of heads of households. The consumer expenditures survey shows average reference person ages. Let's look at ages of the reference person by quintile of income from 2008 (the latest available):
All Consumer Units: 49.1We're dadgum bleeping middle-aged! Our whole society is! And this means that we really need to save more, as should really smack you right between the eyes as you note that the poorest households tend to be the oldest. The cost of medical insurance alone for an older household if they have to buy it on the open market is enough to crush the average budget.
Lowest Income: 51.6
2nd Lowest: 51.6
Median Fifth: 47.9
4th Highest: 46.9
Top Fifth: 47.4
I do not expect US consumer spending to return to the free and easy days of the last two decades in the next two decades. I don't think that CC-funded spending will return to recent norms in the next two decades. I think we will stabilize at a very different mindset. It makes no sense to borrow money at 8% when your returns are much less than that, and financial stability for the average household is acutely dependent on the ability to save. The younger crowd will find that they will have to save money to buy a home or a car. Some cash on the table will become a necessity.
Over time, the return to some fiscal sense will fuel a future growth, but it is not going to fuel much net growth in the next few years.
Saturday, April 17, 2010
I Can't Recommend The Latest Rockefeller Institute Report Enough
Here it is (pdf). The scope of this one is very broad, because it is not just reporting Q4 data but showing a host of comparisons with earlier recessions.
If you read nothing else, go to page 17 and look at the two graphs there, which compare real retail sales and employment declines for this recession to those for the 73, 80, 90, and 01 recessions. These are "AIIIEEEEE, don't go into the basement alone!" graphs. We're in the fiscal equivalent of a really gory slasher movie.
One aspect not covered is that the retirement drag is now going to pick UP real state spending requirements, and it will be comparatively worse for localities. So the long-term declines in revenue will be coupled with even longer-term spending increases.
I am going somewhere with all this; I have some money graphs for you later.
In terms of spending, government expenditures about about 1/4 of personal spending, and state and local are more than half:
 Click on this BEA graph - what's shown is real GDP, real PCE, and government spending.
Anyway, personal PCE has to rise by quite a bit to offset a constraint in government spending - and government spending IS going to be constrained!
Here is pretty much the same graph showing percent change:

The localities get most of their income from property taxes, but they are going to have trouble raising those taxes going forward. The incomes aren't there to support it in a lot of places.
Thursday, April 15, 2010
Note On Initial Claims April 15th Release
Initial claims seasonal adjustments become more volatile around the Easter/Passover holiday every year due to calendar changes and seasonal adjustments. A lot of universities and school systems shut down for multiple weeks, but the timing shifts.
However if the high initial claims figure for this release (SA 484,000) is due to mistaken SA calibration, it is likely that earlier weeks were off too. The last two weeks of April should give us a better indication of where we are.
Actual initial claims for the week ending April 10th were 514,742, compared to the prior year's 610,522. Until state detail comes in next week it will be hard to figure this one - but my guess is that there were logjams in claims processing that shifted earlier weeks lower. In any case the four-week moving average should be more reliable, and that is only 457,750. The previous week's actual claims were 415,012, so it's hard not to see this week's number as reflecting spring break.
However, having written that, there is something very squirrelly here. Normally the pre-spring break low to the spring break high shift in actual claims would be more like 40-50K. So I am guessing that CA didn't get its claims processed again, and that threw the last two weeks of numbers off.
As an afterthought, I am including the industrial production report for March here, because it may shed some light on matters. As I have noted before, the inventory cycle has about cleared, and from here on out it will be more difficult to turn in strong economic growth numbers, because those numbers will depend on final demand.
In March, the total index increased by only .1%. You can see the inventory cycle swing in the October-March numbers:
It's also worth reading this part of the commentary for capacity utilization:
Very tentatively, given the grocery store index, which is raking new lows in an astonishing manner, I would guess that the end of this expansion cycle will come in the June/July period, and a very slow contraction cycle will begin this summer. In the initial stages, I expect GDP to remain positive.
However the bald fact is that our economy appears now completely dependent on growth in government transfer payments. The unpleasant corollary is that taxes are already rising at the state and local levels to support government spending, and will have to rise at the federal level in 2011 to support this spending.
If employment and total wages can't begin to pick up soon, the waning effect of the stimulus, erosion in unemployment benefits, the continued state and local fiscal crisis, the end of the Census stimulus, and the effect of higher production costs will inflict another slow round of economic sapping. The bottom line is that I don't think there can be much more left in the profit margin paring for consumer needs, so at some point the pricing has to rise. But it can't rise, which would imply that production spending will fall net, which would be bad indeed.
I have been discounting the kind of astonishing stuff I am seeing in grocery pricing as somewhat induced by the threat of higher Walmart competition. But still, Walmart is doing what it is doing for a reason, and that reason is that it is hoping to boost volume.
FHA raised its upfront insurance rate effective April 5th to 2.25% for purchases and refis. We won't know the effect of this move for a few weeks, because of course last week's huge dropoff was really due to everyone running the week before to get all their pending apps through before the increase.
But the purchase tax credit is about to expire, and FHA is also going to Congress to ask for the ability to hike up the ongoing insurance rates (those charged with each payment). The current rate is 50-55 bps (0.50 or 0.55% annually). Hope for Homeowners borrowers pay 75 bps. The current hike increases the net mortgage, and an annual rate increase will also do so. Therefore I do not expect mortgages to be hopping later this year, and I strongly suspect a new round of price declines will set in this summer.
However if the high initial claims figure for this release (SA 484,000) is due to mistaken SA calibration, it is likely that earlier weeks were off too. The last two weeks of April should give us a better indication of where we are.
Actual initial claims for the week ending April 10th were 514,742, compared to the prior year's 610,522. Until state detail comes in next week it will be hard to figure this one - but my guess is that there were logjams in claims processing that shifted earlier weeks lower. In any case the four-week moving average should be more reliable, and that is only 457,750. The previous week's actual claims were 415,012, so it's hard not to see this week's number as reflecting spring break.
However, having written that, there is something very squirrelly here. Normally the pre-spring break low to the spring break high shift in actual claims would be more like 40-50K. So I am guessing that CA didn't get its claims processed again, and that threw the last two weeks of numbers off.
As an afterthought, I am including the industrial production report for March here, because it may shed some light on matters. As I have noted before, the inventory cycle has about cleared, and from here on out it will be more difficult to turn in strong economic growth numbers, because those numbers will depend on final demand.
In March, the total index increased by only .1%. You can see the inventory cycle swing in the October-March numbers:
October: +0.2There is a decent chance March will be revised up a bit (February was). However and more to the point, over the year utility production has not managed to increase at all. It is still posting a YoY decline, although I am expecting to see that swing positive in April or May. Production of both consumer goods and non-industrial supplies has been declining for two months.
November: +0.7
December: +0.7
January: +1.0
February: +0.3
March: +0.1
It's also worth reading this part of the commentary for capacity utilization:
Capacity utilization rates in March at industries grouped by stage of process were as follows: At the crude stage, utilization increased 1.1 percentage points to 87.4 percent, a rate 0.9 percentage point above its average for the period from 1972 to 2009; at the primary and semifinished stages, utilization slipped 0.5 percentage point to 69.5 percent, a rate 12.1 percentage points below its long-run average; while at the finished stage, utilization moved up 0.6 percentage point to 71.8 percent, a rate 5.7 percentage points below its long-run average.This relates to the earlier posts I made on manufacturing orders.
Very tentatively, given the grocery store index, which is raking new lows in an astonishing manner, I would guess that the end of this expansion cycle will come in the June/July period, and a very slow contraction cycle will begin this summer. In the initial stages, I expect GDP to remain positive.
However the bald fact is that our economy appears now completely dependent on growth in government transfer payments. The unpleasant corollary is that taxes are already rising at the state and local levels to support government spending, and will have to rise at the federal level in 2011 to support this spending.
If employment and total wages can't begin to pick up soon, the waning effect of the stimulus, erosion in unemployment benefits, the continued state and local fiscal crisis, the end of the Census stimulus, and the effect of higher production costs will inflict another slow round of economic sapping. The bottom line is that I don't think there can be much more left in the profit margin paring for consumer needs, so at some point the pricing has to rise. But it can't rise, which would imply that production spending will fall net, which would be bad indeed.
I have been discounting the kind of astonishing stuff I am seeing in grocery pricing as somewhat induced by the threat of higher Walmart competition. But still, Walmart is doing what it is doing for a reason, and that reason is that it is hoping to boost volume.
FHA raised its upfront insurance rate effective April 5th to 2.25% for purchases and refis. We won't know the effect of this move for a few weeks, because of course last week's huge dropoff was really due to everyone running the week before to get all their pending apps through before the increase.
But the purchase tax credit is about to expire, and FHA is also going to Congress to ask for the ability to hike up the ongoing insurance rates (those charged with each payment). The current rate is 50-55 bps (0.50 or 0.55% annually). Hope for Homeowners borrowers pay 75 bps. The current hike increases the net mortgage, and an annual rate increase will also do so. Therefore I do not expect mortgages to be hopping later this year, and I strongly suspect a new round of price declines will set in this summer.
Tuesday, April 13, 2010
NFIB April (March Survey)
Just awful. Unmitigated angst.
As expected, the employment contraction ended (we were about there last month). From here on out till about the end of 2010, small business employment losses should be concentrated in business closures.
Otherwise, this was jawdroppingly bad. One does not know what to say.
Page 14 shows a huge spike in short-term borrowing rates, but the basic problem is still poor sales. On page 17, the inventory satisfaction graph shows that these businesses aren't going to be making Wall Street very happy unless something changes dramatically.
The total index fell hard to register 86.8 in March. That's what it was in April of last year. In this cycle, the index peaked in January at 89.3. Sales expectations are at their low since last October. February and March outlooks for general business conditions were at their most negative since February and March of 2009, although improved from those levels.
Monday, April 12, 2010
Staring Down The Barrel Of The Gun
US Monthly Treasury Statements: Get 'em here.
In theory, by March we were about ten months into a recovery - but the YoY drops keep coming. And yes, some of this should be due to retirements, but the overall economy is weak enough that even with retirements, we do not seem to be making much progress on unemployment.
The Social Security/Medicare Trustees report is being delayed so they can play with the future projection numbers. But in the face of this, who will believe the numbers?
It is true that some of the lost income is being replaced by retirement benefits, but most of those come from governments one way or another, and the governments are staring down the gun barrel of fiscal disaster.
I have done the gizmo and I am just testing it and writing tutorials (and now I have to upload over 100 web pages somewhere), but the Consumer Expenditure Survey is comprehensive and is updated very late. The last current numbers are from 2008. So without this perspective, it's hard to understand what is happening.
This is what the official US numbers show for personal income (which includes government transfer payments, investment income, rental income and so forth):
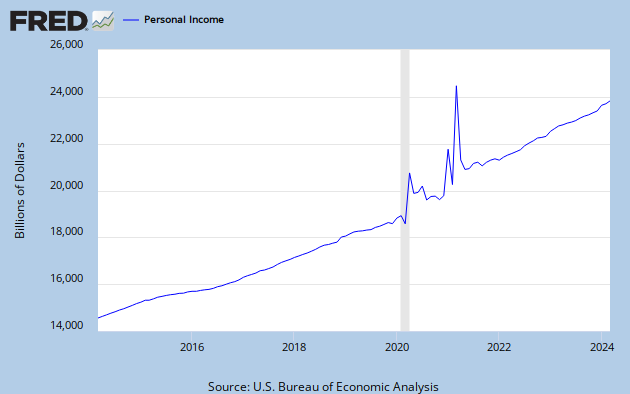
I don't see how these numbers could be correct. They are seasonally adjusted, but rents are falling, interest income is falling (as longer term deposits roll over), and wages are still sliding down YoY.
Anyway, our ability to sustain hefty price increases stemming from an increase in energy costs is just not there, any way you look at it.
Nor has this happened before in my lifetime. Look at the long term graph:

Now when I predicted a depression-like incident, I did so on the basis of my income predictions. And those predictions, according to the tax receipts, appear to have come true. The reason for the sustained fall in sales tax receipts is blindingly obvious from looking at federal tax receipts.
Debt defaults are basically supporting a lot of consumer spending, as are consumers dropping payments for services such as medical insurance (not a good sign). But there is a limit to how long one can sustain spendable income from such sources, and in 2010 we will start to see that effect drop off. The debt card we played in the 1990s and the aughts.
And then there are the unemployment benefits, which will begin to tail off.
I'd say we are in the eye of the deflationary storm.
PS: I see that Snarky Mark has buckled down and started to trail this relationship. Very interesting.
March 2010:Because the hospital insurance portion of FICA (the 2.9% amount) is charged on all wages and self-employment with no dollar limit, this tells us that US taxable wages have fallen 9.4% in two years. What else is there to say?
Hospital FICA: 13,601 (-4.9%)
Hospital Self: 349 (-11.4%)
March 2009:
Hospital FICA: 14,308
Hospital Self: 394
March 2008:
Hospital FICA: 15,013
Hospital Self: 454
2010/2008:
FICA: -9.4%
Self: -23.1%
In theory, by March we were about ten months into a recovery - but the YoY drops keep coming. And yes, some of this should be due to retirements, but the overall economy is weak enough that even with retirements, we do not seem to be making much progress on unemployment.
The Social Security/Medicare Trustees report is being delayed so they can play with the future projection numbers. But in the face of this, who will believe the numbers?
It is true that some of the lost income is being replaced by retirement benefits, but most of those come from governments one way or another, and the governments are staring down the gun barrel of fiscal disaster.
I have done the gizmo and I am just testing it and writing tutorials (and now I have to upload over 100 web pages somewhere), but the Consumer Expenditure Survey is comprehensive and is updated very late. The last current numbers are from 2008. So without this perspective, it's hard to understand what is happening.
This is what the official US numbers show for personal income (which includes government transfer payments, investment income, rental income and so forth):
I don't see how these numbers could be correct. They are seasonally adjusted, but rents are falling, interest income is falling (as longer term deposits roll over), and wages are still sliding down YoY.
Anyway, our ability to sustain hefty price increases stemming from an increase in energy costs is just not there, any way you look at it.
Nor has this happened before in my lifetime. Look at the long term graph:
Now when I predicted a depression-like incident, I did so on the basis of my income predictions. And those predictions, according to the tax receipts, appear to have come true. The reason for the sustained fall in sales tax receipts is blindingly obvious from looking at federal tax receipts.
Debt defaults are basically supporting a lot of consumer spending, as are consumers dropping payments for services such as medical insurance (not a good sign). But there is a limit to how long one can sustain spendable income from such sources, and in 2010 we will start to see that effect drop off. The debt card we played in the 1990s and the aughts.
And then there are the unemployment benefits, which will begin to tail off.
I'd say we are in the eye of the deflationary storm.
PS: I see that Snarky Mark has buckled down and started to trail this relationship. Very interesting.
Friday, April 09, 2010
It Hurt So Good We Just Have To Go Back For More
If I used tags this one would go under S&M Economics.
Juxtaposing
1)This FT article about oil and commodity prices:
Hmm, a raven just flew by and croaked a few words about the economy taking a dive in October 2008, but I am sure it will be different this time . The article also notes that this time oil prices are rising along with the dollar. This means that the effective price of oil is higher for many foreign economies than it was in October 2008.
In part the rise in oil prices appears to be due to Chinese buying. They keep building new oil storage capacity and filling it. ChinaOilWeb.
2) I mentioned Walmart's move to cut their low, low, low prices even further before, but here's another article, complete with a really nice graph of same-store sales changes:

The bad economy has forced Walmart to become more and more dependent on its sales of minor household items, pharmaceuticals and groceries. Walmart is having trouble beating the grocery competition in many markets, so it cut its brand stocking, is going to cut its prices, and is going to try to make some of that back by squeezing more out of the companies supplying the brands. Throughout the 2007-2009 period, Walmart has been steadily increasing its net margins on a lot of this stuff once its bid to go higher end on items like clothing failed:
The final data point is Europe's mad scramble to hide the Greek bond losses. The first attempt - in which institutional investors with an incentive to shore up their own balance sheets doubled down and bought the last bond issue - has failed. Rather dramatically. So the next attempt has to be a very low interest loan. In reality, Greece is going to default one way or another. Either the bondholders in effect write down their debt by buying new bonds or extending new loans (a whole lot of them) at rates way below market value, or Greece just defaults.
Greece is in fact in the driver's seat on this one, as unpleasant a truth as that is. The reason is Italy. The Eurozone can withstand anything that Greece does without a hiccup, but Italy is only about two years behind Greece. And Italy is big. So now Europe is slowly marching into Japanese territory, and that means much lower future growth.
As to the gizmo, after reading the last few days' news, yesterday I decided to shift course and make the gizmo a full-featured (if crude and rude) db application covering the entire Consumer Expenditure Survey database. I think it is time for some perspective on the very important issue of what the US consumer economy can bear in the form of new taxes and costs.
I will have that done in a few days. I am not sure whether it can work on this blog or whether I have to set up a new website for it, but that wouldn't take long to set up a website.
I really need that data to answer some of the questions that readers have recently asked. And I could just write the conclusions out here, but I have developed a strong allergy to that sort of thing, We are suffering from mass delusions caused largely by a few ingroups that are controlling public discussion due to feeble reporting, and the only cure for that ailment is to create easy ways for the average person to parity check what is said in the media.
I don't want to form your opinions. I don't want to broker your political, economic or social views, unless your personal views are based on factual fallacies - in which case, I would like to correct your facts and then let you run free. I want to enable you to form your own opinions based on both facts and data and your own inherent perspectives. The US has a hard economic - and thus social and political - adaptation ahead of us, and almost all the interests that should have been trying to plan for it have instead been trying to fool people into thinking that we don't.
We need new paradigms, and what the heck? Why not try democracy? It may sound insane, but it has worked well for us historically. If average people have some information, they'll figure out the best way forward for us all. It won't be dignified, and it won't make anyone terribly happy, but it will WORK. It will function. That's what we need now. Our enthrallment by our own fantasies are what is sapping our national vitality.
It must be obvious to most thinking people in a very broad set of social spectra that those who should have been making the necessary decisions haven't been. In a democracy, that means that the decision-making power has to shift down to a broader section of the population through the mechanisms of representative government. In other words, you're up at bat. I don't want to change your batting style - I just want to give you a stronger bat and a good solid footing from which to swing.
Juxtaposing
1)This FT article about oil and commodity prices:
This week oil climbed to $87 a barrel, its highest level since October 2008 and prompted concerns that triple-digit crude was once again in the offing.So higher prices create higher prices? What could possibly go wrong? It's a sure thing!
...
Nicholas Colas, ConvergEx Group chief market strategist, says: “With crude oil prices marching steadily higher, portfolio exposure to the energy sector could well become a key determinant of overall investment performance through the balance of 2010.”
Hmm, a raven just flew by and croaked a few words about the economy taking a dive in October 2008, but I am sure
In part the rise in oil prices appears to be due to Chinese buying. They keep building new oil storage capacity and filling it. ChinaOilWeb.
2) I mentioned Walmart's move to cut their low, low, low prices even further before, but here's another article, complete with a really nice graph of same-store sales changes:
The bad economy has forced Walmart to become more and more dependent on its sales of minor household items, pharmaceuticals and groceries. Walmart is having trouble beating the grocery competition in many markets, so it cut its brand stocking, is going to cut its prices, and is going to try to make some of that back by squeezing more out of the companies supplying the brands. Throughout the 2007-2009 period, Walmart has been steadily increasing its net margins on a lot of this stuff once its bid to go higher end on items like clothing failed:
J.P. Morgan analyst Charles Grom wrote this week that his early scouting suggested a more concerted effort by Wal-Mart to convey the image of lower prices, but that he was left wondering how sharp reductions really were.Uh-huh. Here's to Chuck - he's got enough sense to get out of the echo chamber and go find what items really cost. But he's also picking up the residual inflation from the oil increases. Groceries are raising prices too, but on the whole quite a few chains in competitive areas deliver lower overall costs, and the quality of some items is better.
His regular price survey of 31 items at the chain found that the total bill was up 2.3% from the previous month.
The final data point is Europe's mad scramble to hide the Greek bond losses. The first attempt - in which institutional investors with an incentive to shore up their own balance sheets doubled down and bought the last bond issue - has failed. Rather dramatically. So the next attempt has to be a very low interest loan. In reality, Greece is going to default one way or another. Either the bondholders in effect write down their debt by buying new bonds or extending new loans (a whole lot of them) at rates way below market value, or Greece just defaults.
Greece is in fact in the driver's seat on this one, as unpleasant a truth as that is. The reason is Italy. The Eurozone can withstand anything that Greece does without a hiccup, but Italy is only about two years behind Greece. And Italy is big. So now Europe is slowly marching into Japanese territory, and that means much lower future growth.
As to the gizmo, after reading the last few days' news, yesterday I decided to shift course and make the gizmo a full-featured (if crude and rude) db application covering the entire Consumer Expenditure Survey database. I think it is time for some perspective on the very important issue of what the US consumer economy can bear in the form of new taxes and costs.
I will have that done in a few days. I am not sure whether it can work on this blog or whether I have to set up a new website for it, but that wouldn't take long to set up a website.
I really need that data to answer some of the questions that readers have recently asked. And I could just write the conclusions out here, but I have developed a strong allergy to that sort of thing, We are suffering from mass delusions caused largely by a few ingroups that are controlling public discussion due to feeble reporting, and the only cure for that ailment is to create easy ways for the average person to parity check what is said in the media.
I don't want to form your opinions. I don't want to broker your political, economic or social views, unless your personal views are based on factual fallacies - in which case, I would like to correct your facts and then let you run free. I want to enable you to form your own opinions based on both facts and data and your own inherent perspectives. The US has a hard economic - and thus social and political - adaptation ahead of us, and almost all the interests that should have been trying to plan for it have instead been trying to fool people into thinking that we don't.
We need new paradigms, and what the heck? Why not try democracy? It may sound insane, but it has worked well for us historically. If average people have some information, they'll figure out the best way forward for us all. It won't be dignified, and it won't make anyone terribly happy, but it will WORK. It will function. That's what we need now. Our enthrallment by our own fantasies are what is sapping our national vitality.
It must be obvious to most thinking people in a very broad set of social spectra that those who should have been making the necessary decisions haven't been. In a democracy, that means that the decision-making power has to shift down to a broader section of the population through the mechanisms of representative government. In other words, you're up at bat. I don't want to change your batting style - I just want to give you a stronger bat and a good solid footing from which to swing.
Wednesday, April 07, 2010
The Knotty Queston of Sensitivity
See below the gizmo for the explanation!
I wanted to discuss Mark's new analytical angle (measuring elements of the economy against durable goods consumption). And I was all set to discuss the whys and wherefores with a healthy dollop of data served up for your analysis via gizmo from the Consumer Expenditure Survey (aka Consumer Units Az U Have Not Known Them). And I was wafting merrily onwards, having finally almost figured out how to cram this stuff in blogger to my grumpy, lazy satisfaction. (My standards are low.)
And then I realized that I might be writing econo-babble as a result of some discussion on another blog over a contention that was apparently based on a an exercise in bogosity.
So now I am starting a little further back. Skip this post if you and econo-babble are dear friends of long acquaintance. The dice-throwing exercise is here because I want to use it to demonstrate some issues about econometrics, sensitivity and robusticity. Without math.
Definitions:
In economic discussions, "sensitivity" often is casually used to refer to how strongly the economy will react to certain types of forcings.
There is, however, a deeper and more structural meaning of "sensitivity" used in many types of statistical studies and modeling. So I quote from Chapter 12 of the Interactive Textbook on Clinical Symptom Research:
It is really HARD to do this sort of thing well. The study of systems with many unknowns is generally incremental - one has to observe, compile effects, theorize, and test to work out how the system is functioning before one can safely make predictions.
In economics, the system you are studying is constantly changing. You are always chasing a moving target. So relationships that have been true for some time may have shifted, which means that the body of accumulated knowledge on which one is relying may be far less applicable than one believes due to accumulated experience and research. This is a major source of error for very good economists.
Aside from the basic lack of understanding of the entire system, there are other pretty predictable sources of error which are generally unavoidable:
1) Testing too small a sample. Here is the first gizmo exercise for the math-allergic. Leave the defaults as is and run the program. Note that you will get large variances. By definition, three rolls of a six-sided die cannot come out with an even probability distribution.
Suppose (as is usually true during times of extreme economic change) that you do not know the numbers on the dice. The dice are handled by another person. You know that there are six dice, and you get to see only three after a random roll. You are not even going to find out the range of numbers on the six dice, since you will only see three. Not only is this too small a sample, the sample chosen (or available) is too short to even give you an idea of the components of the system.
Try another experiment. Roll the dice 18 times. Repeat that a few times. Most often you will at least get each side represented in the outcome set for 18 rolls. However you will notice that the distribution of outcomes varies substantially for each set of 18 rolls. If the dice are not loaded, in theory each number should have come up three times (18/6). In practice, you won't get close to an even distribution until you start rolling the dice a thousand times. At 10,000 rolls, your variances should mostly be in the low single digits. At 100,000 times, you begin to approach the expected result.
Now change the number of sides to 15. Try rolling the dice 1,000 times, 10,000 times and 100,000 times. You'll see that the variances group considerably higher than for a six-sided die at 1,000 times, but that the variances converge for the higher roll counts.
A 15-sided die rolled 10,000 times is roughly comparable to the measurements we perform on the US economy to calculate GDP. In other words, we are not very good at measuring aspects of the economy that are smaller than about 6% of the total. There is a reason why these numbers are revised for years. We certainly don't know true annual GDP to 50 bps (1/2 a percent) even after years of recalculation.
2) Testing too short an interval: Suppose that the dice are loaded, but they are loaded in such a way as to vary their face bias based on the amount of sunlight available. Clearly, running your sample in at 11:00 AM is not going to give you results predictive of an entire 24 hour cycle.
Economics is dominated by cycles. The most basic is the year. Because of this most important measures are seasonally adjusted, but the seasonal adjustments are a running average of those effects as observed in recent cycles. During times of rapid change, the seasonal adjustments may be disproportionately off for a time. Annual (YoY changes) are the strongest basis for economic analysis for this reason.
There are also effects related to longer economic cycles such as expansions and contractions. Components of the economy that may have relatively steady impacts may abruptly shift to exert unusually strong or weak effects at various stages of cycles. Sometimes the shift is relatively predictable, and sometimes it isn't. The shift can be quite strong - roughly equivalent to a 20-sided die suddenly having 2 faces marked with the same number. Because you are sampling numbers and weighting your sample data based on your belief about the die having 20 separate faces, you can aggregate your sample data and create a very unrealistic result.
The combination of these two sampling problems combined with the need to extrapolate and predict can produce some surprisingly large errors. I will continue this tomorrow.
I wanted to discuss Mark's new analytical angle (measuring elements of the economy against durable goods consumption). And I was all set to discuss the whys and wherefores with a healthy dollop of data served up for your analysis via gizmo from the Consumer Expenditure Survey (aka Consumer Units Az U Have Not Known Them). And I was wafting merrily onwards, having finally almost figured out how to cram this stuff in blogger to my grumpy, lazy satisfaction. (My standards are low.)
And then I realized that I might be writing econo-babble as a result of some discussion on another blog over a contention that was apparently based on a an exercise in bogosity.
So now I am starting a little further back. Skip this post if you and econo-babble are dear friends of long acquaintance. The dice-throwing exercise is here because I want to use it to demonstrate some issues about econometrics, sensitivity and robusticity. Without math.
Definitions:
In economic discussions, "sensitivity" often is casually used to refer to how strongly the economy will react to certain types of forcings.
There is, however, a deeper and more structural meaning of "sensitivity" used in many types of statistical studies and modeling. So I quote from Chapter 12 of the Interactive Textbook on Clinical Symptom Research:
What is Sensitivity Analysis?In short, a sensitivity analysis is an attempt to measure the degree to which it is reasonably likely that the conclusions of the study or model are basically nonsense. The math may be perfect, the eyes may be bright, advanced degrees may adorn the authors' and contributors' names, and funding can be flooding through the door - but nevertheless, you should never, never believe any of it unless assumptions are clearly disclosed and some sort of discussion of the sensitivity analysis is available. If the authors didn't bother to find out whether they were wasting their time, they are either not very good at study design/modeling or they wanted to get to a certain conclusion in the first place. Either way, it's apt to be nonsense.
No matter how well-executed or comprehensive an economic evaluation, the data on costs and outcomes will inevitably contain various degrees of uncertainty and potential bias. Investigators often make best estimates of unknown variables based on available information from experts and the literature.
Sensitivity analyses are performed to test the robustness of study results and conclusions when these underlying assumptions or estimates are varied. This process reveals the degree of uncertainty, imprecision, or methodological controversy in the evaluation.
Examples of questions addressed in sensitivity analysis include the following:
* What if a discount rate of 6% was used instead of 2%?
* What if the compliance rate for influenza vaccination was 10% higher than originally assumed?
* What if the per diem hospital cost underestimated the true economic cost of the health care program by $100?
* What if indirect and intangible costs were not considered?
It is really HARD to do this sort of thing well. The study of systems with many unknowns is generally incremental - one has to observe, compile effects, theorize, and test to work out how the system is functioning before one can safely make predictions.
In economics, the system you are studying is constantly changing. You are always chasing a moving target. So relationships that have been true for some time may have shifted, which means that the body of accumulated knowledge on which one is relying may be far less applicable than one believes due to accumulated experience and research. This is a major source of error for very good economists.
Aside from the basic lack of understanding of the entire system, there are other pretty predictable sources of error which are generally unavoidable:
1) Testing too small a sample. Here is the first gizmo exercise for the math-allergic. Leave the defaults as is and run the program. Note that you will get large variances. By definition, three rolls of a six-sided die cannot come out with an even probability distribution.
Suppose (as is usually true during times of extreme economic change) that you do not know the numbers on the dice. The dice are handled by another person. You know that there are six dice, and you get to see only three after a random roll. You are not even going to find out the range of numbers on the six dice, since you will only see three. Not only is this too small a sample, the sample chosen (or available) is too short to even give you an idea of the components of the system.
Try another experiment. Roll the dice 18 times. Repeat that a few times. Most often you will at least get each side represented in the outcome set for 18 rolls. However you will notice that the distribution of outcomes varies substantially for each set of 18 rolls. If the dice are not loaded, in theory each number should have come up three times (18/6). In practice, you won't get close to an even distribution until you start rolling the dice a thousand times. At 10,000 rolls, your variances should mostly be in the low single digits. At 100,000 times, you begin to approach the expected result.
Now change the number of sides to 15. Try rolling the dice 1,000 times, 10,000 times and 100,000 times. You'll see that the variances group considerably higher than for a six-sided die at 1,000 times, but that the variances converge for the higher roll counts.
A 15-sided die rolled 10,000 times is roughly comparable to the measurements we perform on the US economy to calculate GDP. In other words, we are not very good at measuring aspects of the economy that are smaller than about 6% of the total. There is a reason why these numbers are revised for years. We certainly don't know true annual GDP to 50 bps (1/2 a percent) even after years of recalculation.
2) Testing too short an interval: Suppose that the dice are loaded, but they are loaded in such a way as to vary their face bias based on the amount of sunlight available. Clearly, running your sample in at 11:00 AM is not going to give you results predictive of an entire 24 hour cycle.
Economics is dominated by cycles. The most basic is the year. Because of this most important measures are seasonally adjusted, but the seasonal adjustments are a running average of those effects as observed in recent cycles. During times of rapid change, the seasonal adjustments may be disproportionately off for a time. Annual (YoY changes) are the strongest basis for economic analysis for this reason.
There are also effects related to longer economic cycles such as expansions and contractions. Components of the economy that may have relatively steady impacts may abruptly shift to exert unusually strong or weak effects at various stages of cycles. Sometimes the shift is relatively predictable, and sometimes it isn't. The shift can be quite strong - roughly equivalent to a 20-sided die suddenly having 2 faces marked with the same number. Because you are sampling numbers and weighting your sample data based on your belief about the die having 20 separate faces, you can aggregate your sample data and create a very unrealistic result.
The combination of these two sampling problems combined with the need to extrapolate and predict can produce some surprisingly large errors. I will continue this tomorrow.
Monday, April 05, 2010
Death Of Another Narrative
Gallup looks at the Tea Party demographics:

Almost no statistically significant differences except for white/black. The suggestion is that hispanics incline a bit more to the Tea Party overall. There's more at the link. The most notable stuff is not the Tea Party stats, but the total population stats. With the largest single bloc calling themselves "conservative" (40%), one senses a seismic shift. "Moderates" come in at 38%. "Liberals" are a wussy 21%. In terms of party affiliation, Independents win hands down at 40%. There is also the clear implication that the GOP fouled its nest for some time to come with its recent misdeeds, because 70% of Tea Party supporters call themselves conservatives, but more than half of the Tea Party supporters call themselves Democratic or Independent.
SW looks at the "racist tea-swilling ranters" meme. Only the media and those who deeply desire the reassurance of the concept can believe in it.
Ann Althouse has a post with a link to a Rasmussen poll. In contrast to the Gallup poll, the Rasmussen poll is focused on the voting population, which is somewhere around 53-56% of the adult population. I found the recent Rasmussen segmentation of the voting population very suggestive, although I am somewhat skeptical due to the book-pushing element. But the information about the "political class" does make sense demographically.
One of the vectors pushing the entire Tea Party movement are the concerns of small businesses, aka Main Street America. Another vector appears to be conservative dissatisfaction with the GOP's free-spending ways. Another is the stark terror (induced by our ballooning deficit) in all those who have had life experience in making the numbers add up. Logically, if one is dependent on the government for some essential functions (and who isn't?), then one really, really wants the government to be functional. And if you can't make it functional, you want it out of your way.
IMO journalists are so prejudiced against the Tea Party movement purely because it is not of their making and has sprung into existence below their radar and without their imprimatur. It is like a mirror held up to the MSM that refuses to show them any reflection without the aura of futility with which they are now enshrouded. They attempt to shatter it out of self-defense.
Afterthought: But not all journalists are playing the game. See Samuelson:
And another: This SFGate article on the debt and our currently inane policies points out the problem; our political debate is concentrated on avoiding the reality rather than figuring out how to cope with it. This one whales away at both the GOP and the Dems for trying to bamboozle the public. We are headed straight toward the deficit wall, and virtually our entire political establishment is pretending that we aren't. Is it any wonder that something like the Tea Party has emerged?
I shall not post again until I finish the gizmo to show why Mark's approach has validity.
Almost no statistically significant differences except for white/black. The suggestion is that hispanics incline a bit more to the Tea Party overall. There's more at the link. The most notable stuff is not the Tea Party stats, but the total population stats. With the largest single bloc calling themselves "conservative" (40%), one senses a seismic shift. "Moderates" come in at 38%. "Liberals" are a wussy 21%. In terms of party affiliation, Independents win hands down at 40%. There is also the clear implication that the GOP fouled its nest for some time to come with its recent misdeeds, because 70% of Tea Party supporters call themselves conservatives, but more than half of the Tea Party supporters call themselves Democratic or Independent.
SW looks at the "racist tea-swilling ranters" meme. Only the media and those who deeply desire the reassurance of the concept can believe in it.
Ann Althouse has a post with a link to a Rasmussen poll. In contrast to the Gallup poll, the Rasmussen poll is focused on the voting population, which is somewhere around 53-56% of the adult population. I found the recent Rasmussen segmentation of the voting population very suggestive, although I am somewhat skeptical due to the book-pushing element. But the information about the "political class" does make sense demographically.
One of the vectors pushing the entire Tea Party movement are the concerns of small businesses, aka Main Street America. Another vector appears to be conservative dissatisfaction with the GOP's free-spending ways. Another is the stark terror (induced by our ballooning deficit) in all those who have had life experience in making the numbers add up. Logically, if one is dependent on the government for some essential functions (and who isn't?), then one really, really wants the government to be functional. And if you can't make it functional, you want it out of your way.
IMO journalists are so prejudiced against the Tea Party movement purely because it is not of their making and has sprung into existence below their radar and without their imprimatur. It is like a mirror held up to the MSM that refuses to show them any reflection without the aura of futility with which they are now enshrouded. They attempt to shatter it out of self-defense.
Afterthought: But not all journalists are playing the game. See Samuelson:
My argument was that politics increasingly devotes itself to making people feel good about themselves -- elevating their sense of self-worth and affirming their belief in their moral superiority. By contrast, the standard view of politics is that it mediates conflicting interests and ideas.I disagree with Samuelson often enough to enjoy reading him. I never find his writing superficial.
And another: This SFGate article on the debt and our currently inane policies points out the problem; our political debate is concentrated on avoiding the reality rather than figuring out how to cope with it. This one whales away at both the GOP and the Dems for trying to bamboozle the public. We are headed straight toward the deficit wall, and virtually our entire political establishment is pretending that we aren't. Is it any wonder that something like the Tea Party has emerged?
I shall not post again until I finish the gizmo to show why Mark's approach has validity.
Sunday, April 04, 2010
Testing Something
Saturday, April 03, 2010
I'm Alive!
Don't walk - run over to Mark at Illusion of Prosperity's post on real estate malinvestment.
More on his conclusion later (whenever I get to it, 'cause I'm hip deep).
More on his conclusion later (whenever I get to it, 'cause I'm hip deep).
Thursday, April 01, 2010
Sorry, No Post Today
I am whipped, and I have to be up and out at 0 dark thirty tomorrow morning.
Most of today's reports were good, though. I just flipped through them, and it was a nice, springy feeling.
PS: I am hauling hod at SuperDoc's. Siegel's article is the reason why. That's what I see at SuperDoc's. It's pretty scary. The system is about to bust.
Most of today's reports were good, though. I just flipped through them, and it was a nice, springy feeling.
PS: I am hauling hod at SuperDoc's. Siegel's article is the reason why. That's what I see at SuperDoc's. It's pretty scary. The system is about to bust.
![]()
